Economics after Moore’s Law

One of the dominating features of the economy over the last fifty years has been Moore’s law, which has led to exponential growth in computing power and exponential drops in its costs. This period is now coming to an end. This doesn’t mean that technological progress in computing will stop dead, nor that innovation in ICT comes to an end, but it is a pivotal change, and I’m surprised that we’re not seeing more discussion of its economic implications.

This reflects, perhaps, the degree to which some economists seem to be both ill-informed and incurious about the material and technical basis of technological innovation (for a very prominent example, see my review of Robert Gordon’s recent widely read book, The Rise and Fall of American Growth). On the other hand, boosters of the idea of accelerating change are happy to accept it as axiomatic that these technological advances will always continue at the same, or faster rates. Of course, the future is deeply uncertain, and I am not going to attempt to make many predictions. But here’s my attempt to identify some of the issues

How we got here

The era of Moore’s law began with the invention in 1959 of the integrated circuit. Transistors are the basic unit of electronic unit, and in an integrated circuit many transistors could be incorporated on a single component to make a functional device. As the technology for making integrated circuits rapidly improved, Gordon Moore, in 1965 predicted that the number of transistors on a single silicon chip would double every year (the doubling time was later revised to 18 months, but in this form the “law” has well described the products of the semiconductor industry ever since).

The full potential of integrated circuits was realised when, in effect, a complete computer was built on a single chip of silicon – a microprocessor. The first microprocessor was made in 1970, to serve as the flight control computer for the F14 Tomcat. Shortly afterwards a civilian microprocessor was released by Intel – the 4004. This was followed in 1974 by the Intel 8080 and its competitors, which were the devices that launched the personal computer revolution.

The Intel 8080 had transistors with a minimum feature size of 6 µm. Moore’s law was driven by a steady reduction in this feature size – by 2000, Intel’s Pentium 4’s transistors were more than 30 times smaller. This drove the huge increase in computer power between the two chips in two ways. Obviously, more transistors gives you more logic gates, and more is better. Less obviously, another regularity known as Dennard scaling states that as transistor dimensions are shrunk, each transistor operates faster and uses less power. The combination of Moore’s law and Dennard scaling was what led to the golden age of microprocessors, from the mid-1990’s, where every two years a new generation of technology would be introduced, each one giving computers that were cheaper and faster than the last.

This golden age began to break down around 2004. Transistors were still shrinking, but the first physical limit was encountered. Further increases in speed became impossible to sustain, because the processors simply ran too hot. To get round this, a new strategy was introduced – the introduction of multiple cores. The transistors weren’t getting much faster, but more computer power came from having more of them – at the cost of some software complexity. This marked a break in the curve of improvement of computer power with time, as shown in the figure below.
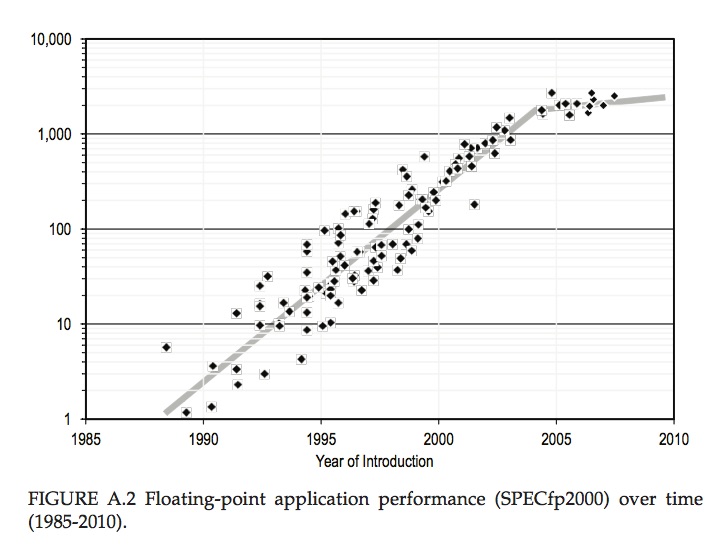

Computer performance trends as measured by the SPECfp2000 standard for floating point performance, normalised to a typical 1985 value. This shows an exponential growth in computer power from 1985 to 2004 at a compound annual rate exceeding 50%, and slower growth between 2004 and 2010. From “The Future of Computing Performance: Game Over or Next Level?”, National Academies Press 2011″

In this period, transistor dimensions were still shrinking, even if they weren’t becoming faster, and the cost per transistor was still going down. But as dimensions shrunk to tens of nanometers, chip designers ran out of space, and further increases in density were only possible by moving into the third dimension. The “FinFET” design, introduced in 2011 essentially stood the transistors on their side. At this point the reduction in cost per transistor began to level off, and since then the development cycle has begun to slow, with Intel announcing a move from a two year cycle to one of three years.

The cost of sustaining Moore’s law can be measured in diminishing returns from R&D efforts (estimated by Bloom et al as a roughly 8-fold increase in research effort, measured as R&D expenditure deflated by researcher salaries, from 1995 to 2015), and above all by rocketing capital costs.

Oligopoly concentration

The cost of the most advanced semiconductor factories (fabs) now exceeds $10 billion, with individual tools approaching $100 million. This rocketing cost of entry means that now only four companies in the world have the capacity to make semiconductor chips at the technological leading edge.

These firms are Intel (USA), Samsung (Korea), TSMC (Taiwan) and Global Foundries (USA/Singapore based, but owned by the Abu Dhabi sovereign wealth fund). Other important names in semiconductors are now “fabless” – they design chips, that are then manufactured in fabs operated by one of these four. These fabless firms include nVidia – famous for the graphical processing units that have been so important for computer games, but which are now becoming important for the high performance computing needed for AI and machine learning, and ARM (until recently UK based and owned, but recently bought by Japan’s SoftBank), designer of low power CPUs for mobile devices.

It’s not clear to me how the landscape evolves from here. Will there be further consolidation? Or in an an environment of increasing economic nationalism, will ambitious nations regard advanced semiconductor manufacture as a necessary sovereign capability, to be acquired even in the teeth of pure economic logic? Of course, I’m thinking mostly of China in this context – its government has a clearly stated policy of attaining technological leadership in advanced semiconductor manufacturing.

Cheap as chips

The flip-side of diminishing returns and slowing development cycles at the technological leading edge is that it will make sense to keep those fabs making less advanced devices in production for longer. And since so much of the cost of an IC is essentially the amortised cost of capital, once that is written off the marginal cost of making more chips in an old fab is small. So we can expect the cost of trailing edge microprocessors to fall precipitously. This provides the economic driving force for the idea of the “internet of things”. Essentially, it will be possible to provide a degree of product differentiation by introducing logic circuits into all sorts of artefacts – putting a microprocessor in every toaster, in other words.

Although there are applications where cheap embedded computing power can be very valuable, I’m not sure this is a universally good idea. There is a danger that we will accept relatively marginal benefits (the ability to switch our home lights on with our smart-phones, for example) at the price of some costs that may not be immediately obvious. There will be a general loss of transparency and robustness of everyday technologies, and the potential for some insidious potential harms, through vulnerability to hostile cyberattacks, for example. Caution is required!

Travelling without a roadmap

Another important feature of the golden age of Moore’s law and Dennard scaling was a social innovation – the International Technology Roadmap for Semiconductors. This was an important (and I think unique) device for coordinating and setting the pace for innovation across a widely dispersed industry, comprising equipment suppliers, semiconductor manufacturers, and systems integrators. The relentless cycle of improvement demanded R&D in all sorts of areas – the materials science of the semiconductors, insulators and metals and their interfaces, the chemistry of resists, the optics underlying the lithography process – and this R&D needed to be started not in time for the next upgrade, but many years in advance of when it was anticipated it would be needed. Meanwhile businesses could plan products that wouldn’t be viable with the computer power available at that time, but which could be expected in the future.

Moore’s law was a self-fulfilling prophecy, and the ITRS was the document that both predicted the future, and made sure that that future happened. I write this in the past tense, because there will be no more roadmaps. Changing industry conditions – especially the concentration of leading edge manufacturing – has brought this phase to an end, and the last International Technology Roadmap for Semiconductors was issued in 2015.

What does all this mean for the broader economy?

The impact of fifty years of exponential technological progress in computing seems obvious, yet quantifying its contribution to the economy is more difficult. In developed countries, the information and communication technology sector has itself been a major part of the economy which has demonstrated very fast productivity growth. In fact, the rapidity of technological change has itself made the measurement of economic growth more difficult, with problems arising in accounting for the huge increases in quality at a given price for personal computers, and the introduction of entirely new devices such as smartphones.

But the effects of these technological advances on the rest of the economy must surely be even larger than the direct contribution of the ICT sector. Indeed, even countries without a significant ICT industry of their own must also have benefitted from these advances. The classical theory of economic growth due to Solow can’t deal with this, as it isn’t able to handle a situation in which different areas of technology are advancing at very different rates (a situation which has been universal since at least the industrial revolution).

One attempt to deal with this was made by Oulton, who used a two-sector model to take into account the the effect of improved ICT technology in other sectors, by increasing the cost-effectiveness of ICT related capital investment in those sectors. This does allow one to make some account for the broader impact of improvements in ICT, but I still don’t think it handles the changes in relative value over time that different rates of technological improvement imply. Nonetheless, it allows one to argue for substantial contributions to economic growth from these developments.

Have we got the power?

I want to conclude with two questions for the future. I’ve already discussed the power consumption – and dissipation – of microprocessors in the context of the mid-2000’s end of Dennard scaling. Any user of a modern laptop is conscious of how much heat they generate. Aggregating the power demands of all the computing devices in the world produces a total that is a significant fraction of total energy use, and which is growing fast.

The plot below shows an estimate for the total world power consumption of ICT. This is highly approximate (and as far as the current situation goes, it looks, if anything, somewhat conservative). But it does make clear that the current trajectory is unsustainable in the context of the need to cut carbon emissions dramatically over the coming decades.
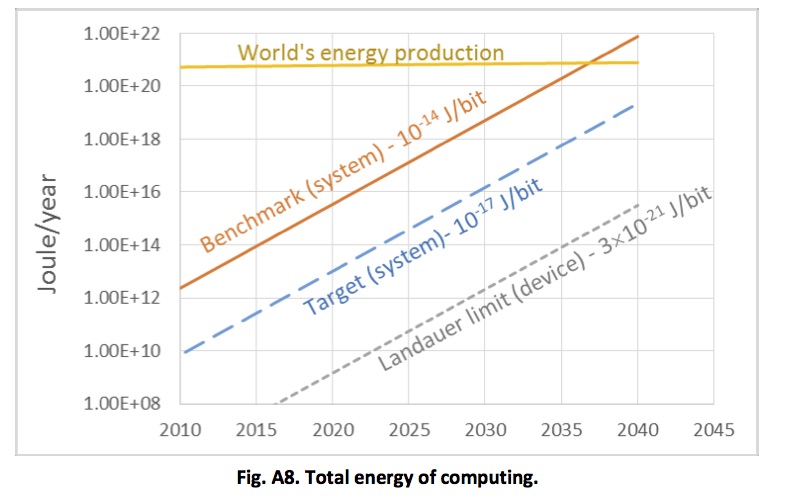

Estimated total world energy consumption for information and communication technology. From Rebooting the IT Revolution: a call to action – Semiconductor Industry Association, 2015

These rising power demands aren’t driven by more lap-tops – its the rising demands of the data centres that power the “cloud”. As smart phones became ubiquitous, we’ve seen the computing and data storage that they need move from the devices themselves, limited as they are by power consumption, to the cloud. A service like Apple’s Siri relies on technologies of natural language processing and machine learning that are much too computer intensive for the processor in the phone, and instead are run on the vast banks of microprocessors in one of Apple’s data centres.

The energy consumption of these data centres is huge and growing. By 2030, a single data centre is expected to be using 2000 MkWh per year, of which 500 MkWh is needed for cooling alone. This amounts to a power consumption of around 0.2 GW, a substantial fraction of the output of a large power station. Computer power is starting to look a little like aluminium, something that is exported from regions where electricity is cheap (and hopefully low carbon in origin). However there are limits to this concentration of computer power – the physical limit on the speed of information transfer imposed by the speed of light is significant, and the volume of information is limited by available bandwidth (especially for wireless access).

The other question is what we need that computing power for. Much of the driving force for increased computing power in recent years has been from gaming – the power needed to simulate and render realistic virtual worlds that has driven the development of powerful graphics processing units. Now it is the demands of artificial intelligence and machine learning that are straining current capacity. Truly autonomous systems, like self-driving cars, will need stupendous amounts of computer power, and presumably for true autonomy much of this computing will need to be done locally rather than in the cloud. I don’t know how big this challenge is.

Where do we go from here?

In the near term, Moore’s law is good for another few cycles of shrinkage, moving more into the third dimension by stacking increasing numbers of layers vertically, shrinking dimensions further by using extreme UV for lithography. How far can this take us? The technical problems of EUV are substantial, and have already absorbed major R&D investments. The current approaches for multiplying transistors will reach their end-point, whether killed by technical or economic problems, perhaps within the next decade.

Other physical substrates for computing are possible and are the subject of R&D at the moment, but none yet has a clear pathway for implementation. Quantum computing excites physicists, but we’re still some way from a manufacturable and useful device for general purpose computing.

There is one cause for optimism, though, which relates to energy consumption. There is a physical lower limit on how much energy it takes to carry out a computation – the Landauer limit. The plot above shows that our current technology for computing consumes energy at a rate which is many orders of magnitude greater than this theoretical limit (and for that matter, it is much more energy intensive than biological computing). There is huge room for improvement – the only question is whether we can deploy R&D resources to pursue this goal on the scale that’s gone into computing as we know it today.

See also Has Moore’s Law been repealed? An economist’s perspective, by Keith Flamm, in Computing in Science and Engineering, 2017
Towards a coherent industrial strategy for the UK

What should a modern industrial strategy for the UK look like? This week the Industrial Strategy Commission, of which I’m a member, published its interim report – Laying the Foundations – which sets out some positive principles which we suggest could form the basis for an Industrial Strategy. This follows the government’s own Green Paper, Building our Industrial Strategy, to which we made a formal response here. I made some personal comments of my own here. The government is expected to publish its formal policy on Industrial Strategy, in a White Paper, in the autumn.

There’s a summary of our report on the website, and my colleague and co-author Diane Coyle has blogged about it here. Here’s my own perspective on the most important points.

Weaknesses of the UK’s economy

The starting point must be a recognition of the multiple and persistent weaknesses of the UK economy, which go back to the financial crisis and beyond. We still hear politicians and commentators asserting that the economy is fundamentally strong, in defiance both of the statistical evidence and the obvious political consequences we’ve seen unfolding over the last year or two. Now we need to face reality.

The UK’s economy has three key weaknesses. Its productivity performance is poor; there’s a big gap between the UK and competitor economies, and since the financial crisis productivity growth has been stagnant. This poor productivity performance translates directly into stagnant wage growth and a persistent government fiscal deficit.

There are very large disparities in economic performance across the country; the core cities outside London, rather than being drivers of economic growth, are (with the exception of Bristol and Aberdeen) below the UK average in GVA per head. De-industrialised regions and rural and coastal peripheries are doing even worse. The UK can’t achieve its potential if large parts of it are held back from fully contributing to economic growth.

The international trading position of the country is weak, with large and persistent deficits in the current account. BREXIT threatens big changes to our trading relationships, so this is not a good place to be starting from.

Inadequacy of previous policy responses

The obvious corollary of the UK’s economic weakness has to be a realisation that whatever we’ve been doing up to now, it hasn’t been working. This isn’t to say that the UK hasn’t had policies for industry and economic growth – it has, and some of them have been good ones. But a collection of policies doesn’t amount to a strategy, and the results tell us that even the good policies haven’t been executed at a scale that makes a material difference to the problems we’ve faced.

A strategy should begin with a widely shared vision

A strategy needs to start with a vision of where the country is going, around which a sense of national purpose can be build. How is the country going to make a living, how is it going to meet the challenges it’s facing? This needs to be clearly articulated and a consensus built that will last longer than one political cycle. It needs to be founded on a realistic understanding of the UK’s place in the world, and of the wider technological changes that are unfolding globally.

Big problems that need to be solved

We suggest six big problems that an industrial strategy should be built around.

  • Decarbonisation of the energy economy whilst maintaining affordability and security of the energy supply.
  • Ensuring adequate investment in infrastructure to meet current and future needs and priorities.
  • Developing a sustainable health and social care system.
  • Unlocking long-term investment – and creating a stable environment for long-term investments.
  • Supporting established and emerging high-value industries – and building export capacity in a changing trading environment.
  • Enabling growth in parts of the UK outside London and the South East in order to increase the UK’s overall productivity and growth.
  • Industrial strategy should be about getting the public and private sectors to work together in a way that simultaneously achieves these goals and creates economic value and growing productivity

    Some policy areas to focus on

    The report highlights a number of areas in which current approaches fail. Here are a few:

  • our government institutions don’t work well enough; they are too centralised in London, and yet departments and agencies don’t cooperate enough with each other in support of bigger goals,
  • the approach government takes to cost-benefit analysis is essentially incremental; it doesn’t account for or aspire to transformative change, which means that in automatically concentrates resources in areas that are already successful,
  • our science and innovation policy doesn’t look widely enough at the whole innovation landscape, including translational research and private sector R&D, and the distribution of R&D capacity across the country,
  • our skills policy has been an extreme example of a more general problem of policy churn, with a continuous stream of new initiatives being introduced before existing policies have had a chance to prove their worth or otherwise.
  • The Industrial Strategy Commission

    The Industrial Strategy Commission is a joint initiative of the Sheffield Political Economy Research Institute and the University of Manchester’s Policy@Manchester unit. My colleagues on the commission are the economist Diane Coyle, the political scientist Craig Berry, policy expert Andy Westwood, and we’re chaired by Dame Kate Barker, a very distinguished business economist and former member of the Bank of England’s powerful Monetary Policy Committee. We benefit from very able research support from Tom Hunt and Marianne Sensier.

    It’s the economy, stupid

    There’s a piece of folk political science (attributed to Bill Clinton’s campaign manager) that says the only thing that matters in electoral politics is the state of the economy. Forget about leadership, ideology, manifestos containing a doorstep-friendly “retail offer”; what solely matters, in this view, is whether people feel that their own financial position is going in the right direction. Given the chaos of British electoral politics at the moment, it’s worth taking a look at the data to test this notion. What can the economic figures tell us about the current state of UK politics?

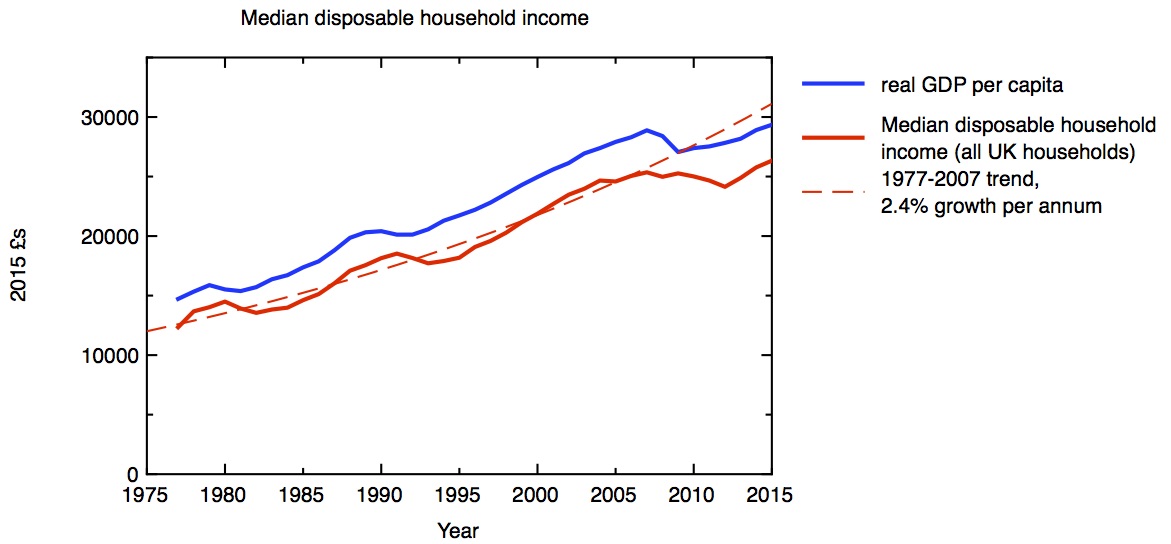
    Median household disposable income in 2015 £s, compared to real GDP per capita. ONS: Household disposable income and inequality Jan 2017 release

    How well off do people feel? The best measure of this is the disposable household income – that’s income and benefits, less taxes. My first plot shows how real terms median disposable household income has varied over the last 30 years or so. Up to 2007, the trend is for steady growth of 2.4% a year; around this trend we have occasional recessions, during which household income first falls, and then recovers to the trend line and overshoots a little. The recovery from the recession following the 2007 financial crisis has been slower than either of the previous two recessions, and as a result household incomes are still a long way below getting back to the trend line. Whereas the median household a decade ago had got used to continually rising disposable income, in the last decade it’s seen barely any change. To relate what happens to the individual household to the economy at large, I plot the real gross domestic product per head on the same graph. The two curves mirror each other closely, with a small time-lag between changes to GDP and changes to household incomes. Broadly speaking, the stagnation we’re seeing in the economy as a whole (when expressed on a per capita basis) directly translates into slow or no growth in people’s individual disposable incomes.

    Of course, not everybody is the median household. There are important issues about how income inequality is changing with time. Median household incomes vary strongly across the country too, from the prosperity of London and the Southeast to the much lower median incomes in the de-industrialised regions and the rural peripheries. Here I just want to discuss one source of difference – between retired households and non-retired households. This is illustrated in my second plot. In general, retired households are less exposed to recessions than non-retired households, but the divergence in income growth rate between retired and non-retired households since the financial crisis is striking. This makes less surprising the observation that, in recent elections, it is age rather than class that provides the most fundamental political dividing line.

    Growth in median disposable income for retired and non-retired households, plotted as a ratio with 1995 median values: £12901 for retired and £20618 for non-retired. ONS: Household disposable income and inequality Jan 2017 release

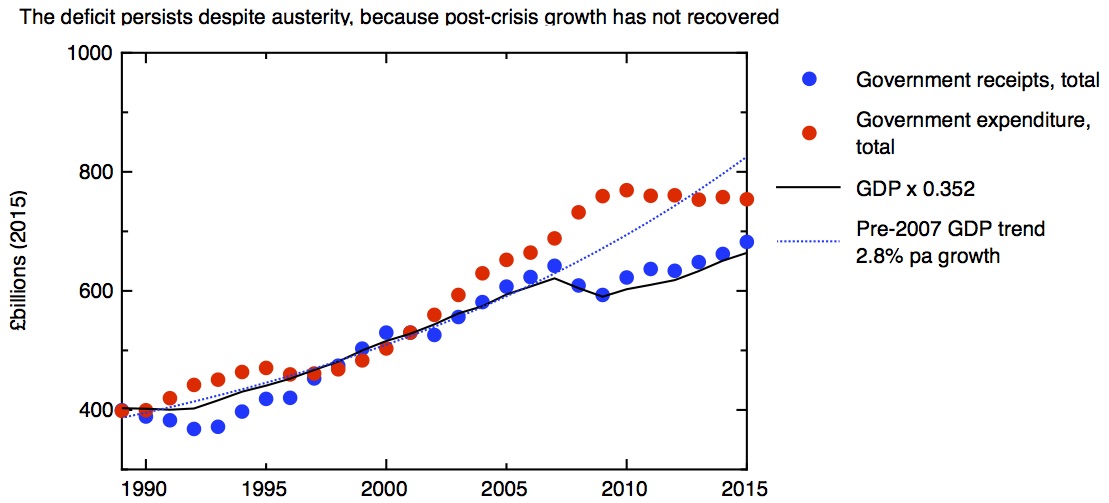
    What underlies the growing narrative that the public is tiring of austerity, as measured by the quality of public services people encounter day to day? The fiscal position of the government is measured by the difference between the money in takes in in taxes and the money it spends on public services – the difference between the two is the deficit. My next plot shows government receipts and expenditure since 1989. Receipts (various types of tax and national insurance) fairly closely mirror GDP, falling in recessions and rising in economic booms. For all the theatre of the Budget, changes in the tax system make rather marginal differences to this. Over this period tax receipts average about 0.35 times the total GDP. Meanwhile expenditure increases in recessions, leading to deficits.

    Total government expenditure, and total government receipts, in 2015 £s. For comparison, real GDP multiplied by 0.352, which gives the best fit in a linear regression of GDP to government receipts over the period. Data: OBR Historical Official Forecasts database.

    The plot clearly shows the introduction of “austerity” after 2010, in the shape of a real fall in government expenditure. But in contrast to the previous recession, five years of austerity still hasn’t closed the gap between income and expenditure, and the deficit persistently remains. The reason for this is obvious from the plot – tax receipts, tracking GDP closely, haven’t grown enough to close the gap. Austerity has not succeeded in eliminating the deficit, because economic growth still hasn’t recovered from the financial crisis. If the economy had returned to the pre-crisis trend by 2015, then the deficit would have turned to surplus, and austerity would not be needed.

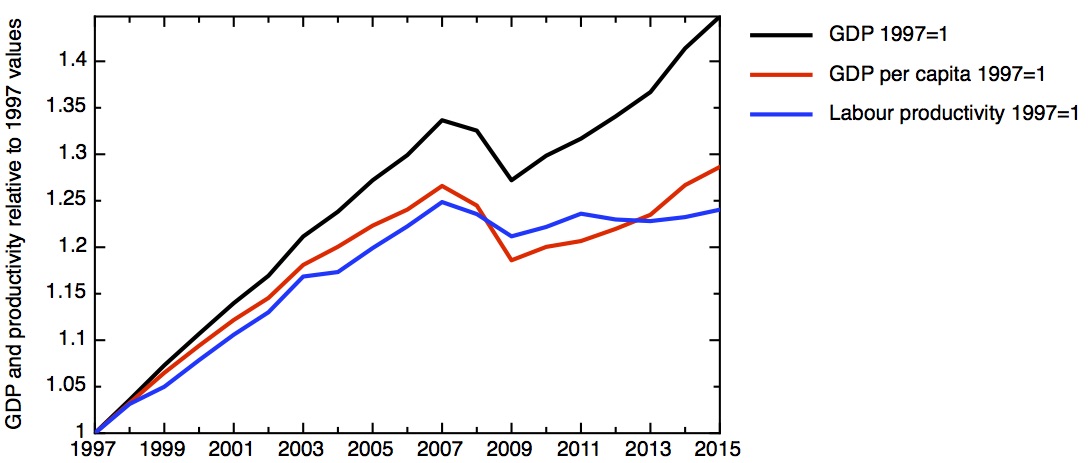
    How do we measure economic growth? My next plot shows three important measures. The measure of total activity in the economy is given by GDP – Gross Domestic Product. This measure is the right one for the government to worry about when it is concerned whether overall government debt is sustainable – as my third plot shows, this is the measure of economic growth that the total tax take most closely tracks. It is certainly the government’s favourite measure when it is talking up how strong the UK economy is. But what is more important for the individual voter is the GDP per person. Obviously a bigger GDP doesn’t help an individual if has to be shared out among a bigger population, so it’s not surprising that household income tracks GDP per capita more closely than total GDP. As the plot shows, growth in GDP per capita has been significantly lower than total GDP, the difference being due to the growth in the country’s population due to net inward migration.

    Growth in real GDP, real GDP per capita, and labour productivity: ratio to 1997 value. Data: Bank of England: A millennium of macroeconomic data v 3

    Perhaps the most important quanitity derived from the GDP is labour productivity, simply defined as the GDP divided by the total number of hours worked. This evens out fluctuations due to business cycle, which affect the rates of employment, unemployment and underemployment.

    Growth in productivity – the amount of value created by a fixed amount of labour – reflects a combination of how much capital is invested (in new machines, for example) with improvements in technology, broadly defined, and organisation. Increasing productivity is the only sustainable source of increasing economic growth. So it is the near-flatlining of productivity since the financial crisis which underlies so many of our economic woes.

    It’s important to recognise that GDP isn’t a fundamental property of nature, it’s a construct which contains many assumptions. There’s no better place to start to get to grips with this than in the book GDP: a brief but affectionate history, by my distinguished colleague on the Industrial Strategy Commission, Diane Coyle. Here I’ll mention three particular issues.

    The first is the question of what types of activity count as a market activity. If you care for your aging parent yourself, that’s hard and valuable work, but it doesn’t count in the GDP figures because money doesn’t change hands. But if the caring is done by someone else, in a care home, that now counts in GDP. On the other hand, if you use a piece of open source software rather than a paid-for package, that has the effect of reducing GDP – the unpaid efforts of the open source community who made the software may make a huge contribution to the economy but they don’t show up in GDP. Clearly, social and economic changes have the potential to move the “production boundary” in either direction. The second question is more technical, but particularly important in understanding the UK in recent years. This is how the GDP statistics treat financial services and housing. Just because the GDP numbers appear in an authoritative spreadsheet, one shouldn’t make the mistake of believing that they are unquestionable or that they won’t be subject to revision.

    This is even more true when one considers the way that we compare the value of economic activity at different times. Obviously money changes in value over time due to inflation. My graphs attempt to account for inflation through simple numerical factors. In the case of household income, inflation was corrected for using CPI-H – the Consumer Prices Index (including housing costs). This is produced by comparing the price of a “typical” basket of goods and services over time. For the GDP and productivity figures, the correction is made through the “GDP deflator”, which attempts to map the changing prices of everything in the economy. The issue is that, at a time of technological and social change, relative values of different goods change. Most obviously, Moore’s law has led to computers get much more powerful at a given price; even more problematically entirely new products, like smart phones, appear. If these effects are important on the scale of the whole economy, as Diane has recently argued, this could account for some of the measured slow-down in GDP and productivity growth.

    But politics is driven by people’s perceptions; if many people think that the economy has stopped working for them in recent years, the statistics bear that out. The UK’s economy at the moment is not strong, contrary to the assertions of some politicians and commentators. A sustained period of weak growth has translated into stagnant living standards and great difficulties in getting the government’s finances back into balance, despite sustained austerity.

    We now need to confront this economic weakness, accept that some of our assumptions about how the economy works have been proved wrong, and develop some new thinking about how to change this. That’s what the Industrial Strategy Commission is trying to do.

    How Sheffield became Steel City: what local history can teach us about innovation

    As someone interested in the history of innovation, I take great pleasure in seeing the many tangible reminders of the industrial revolution that are to be found where I live and work, in North Derbyshire and Sheffield. I get the impression that academics are sometimes a little snooty about local history, seeing it as the domain of amateurs and enthusiasts. If so, this would be a pity, because a deeper understanding of the histories of particular places could be helpful in providing some tests of, and illustrations for, the grand theories that are the currency of academics. I’ve recently read the late David Hey’s excellent “History of Sheffield”, and this prompted these reflections on what we can learn about the history of innovation from the example of this city, which became so famous for its steel industries. What can we learn from the rise (and fall) of steel in Sheffield?

    Specialisation

    “Ther was no man, for peril, dorste hym touche.
    A Sheffeld thwitel baar he in his hose.”

    The Reeves Tale, Canterbury Tales, Chaucer.

    When the Londoner Geoffrey Chaucer wrote these words, in the late 14th century, the reputation of Sheffield as a place that knives came from (Thwitel = whittle: a knife) was already established. As early as 1379, 25% of the population of Sheffield were listed as metal-workers. This was a degree of focus that was early, and well developed, but not completely exceptional – the development of medieval urban economies in response to widening patterns of trade was already leading to specialisation based on the particular advantages location or natural resources gave them[1]. Towns like Halifax and Salisbury (and many others) were developing clusters in textiles, while other towns found narrower niches, like Burton-on-Trent’s twin trades of religious statuary and beer. Burton’s seemingly odd combination arose from the local deposits of gypsum [2]; what was behind Sheffield’s choice of blades?

    I don’t think the answer to this question is at all obvious. Continue reading “How Sheffield became Steel City: what local history can teach us about innovation”

    What hope against dementia?

    An essay review of Kathleen Taylor’s book “The Fragile Brain: the strange, hopeful science of dementia”, published by OUP.

    I am 56 years old; the average UK male of that age can expect to live to 82, at current levels of life expectancy. This, to me, seems good news. What’s less good, though, is that if I do reach that age, there’s about a 10% chance that I will be suffering from dementia, if the current prevalence of that disease persists. If I were a woman, at my age I could expect to live to nearly 85; the three extra years come at a cost, though. At 85, the chance of a woman suffering from dementia is around 20%, according to the data in Alzheimers Society Dementia UK report. Of course, for many people of my age, dementia isn’t a focus for their own future anxieties, it’s a pressing everyday reality as they look after their own parents or elderly relatives, if they are among the 850,000 people who currently suffer from dementia. I give thanks that I have been spared this myself, but it doesn’t take much imagination to see how distressing this devastating and incurable condition must be, both for the sufferers, and for their relatives and carers. Dementia is surely one of the most pressing issues of our time, so Kathleen Taylor’s impressive overview of the subject is timely and welcome.

    There is currently no cure for the most common forms of dementia – such as Alzheimer’s disease – and in some ways the prospect of a cure seems further away now than it did a decade ago. The number of drugs which have been demonstrated to work to cure or slow down Alzheimer’s disease remains at zero, despite billions of dollars having been spent in research and drug trials, and it’s arguable that we understand less now about the fundamental causes of these diseases, than we thought we did a decade ago. If the prevalence of dementia remains unchanged, by 2051, the number of dementia sufferers in the UK will have increased to 2 million.

    This increase is the dark side of the otherwise positive story of improving longevity, because the prevalence of dementia increases roughly exponentially with age. To return to my own prospects as a 56 year old male living in the UK, one can make another estimate of my remaining lifespan, adding the assumption that the increases in longevity we’ve seen recently continue. On the high longevity estimates of the Office of National Statistics, an average 56 year old man could expect to live to 88 – but at that age, there would be a 15% chance of suffering from dementia. For woman, the prediction is even better for longevity – and worse for dementia – with an life expectancy of 91, but a 20% chance of dementia (there is a significantly higher prevalence of dementia for women than men at a given age, as well as systematically higher life expectancy). To look even further into the future, a girl turning 16 today can expect to live to more than 100 in this high longevity scenario – but that brings her chances of suffering dementia towards 50/50.

    What hope is there for changing this situation, and finding a cure for these diseases? Dementias are neurodegenerative diseases; as they take hold, nerve cells become dysfunctional and then die off completely. They have different effects, depending on which part of the brain and nervous system is primarily affected. The most common is Alzheimer’s disease, which accounts for more than half of dementias in the over 65’s, and begins by affecting the memory, and then progresses to a more general loss of cognitive ability. In Alzheimer’s, it is the parts of the the brain cortex that deal with memory that atrophy, while in frontotemporal dementia it is the frontal lobe and/or the temporal cortex that are affected, resulting in personality changes and loss of language. In motor neurone diseases (of which the most common is ALS, amyotrophic lateral sclerosis, also known as Lou Gehrig’s disease), it is the nerves in the brainstem and spinal cord that control the voluntary movement of muscles that are affected, leading to paralysis, breathing difficulties, and loss of speech. The mechanisms underlying the different dementias and other neurodegenerative diseases differ in detail, but they have features in common and the demarcations between them aren’t always well defined.

    It’s not easy to get a grip on the science that underlies dementia – it encompasses genetics, cell and structural biology, immunology, epidemiology, and neuroscience in all its dimensions. Taylor’s book gives an outstanding and up-to-date overview of all these aspects. It’s clearly written, but it doesn’t shy away from the complexity of the subject, which makes it not always easy going. The book concentrates on Alzheimer’s disease, taking that story from the eponymous doctor who first identified the disease in 1901.

    Dr Alois Alzheimer identified the brain pathology characteristic of Alzheimer’s disease – including the characteristic “amyloid plaques”. These consist of strongly associated, highly insoluble aggregates of protein molecules; subsequent work has identified both the protein involved and the structure it forms. The structure of amyloids – in which protein chains are bound together in sheets by strong hydrogen bonds – can be found in many different proteins, (I discussed this a while ago on this blog, in Death, Life and Amyloids) and when these structures occur in biological systems they are usually associated with disease states. In Alzheimer’s, the particular protein involved is called Aβ; this is a fragment of a larger protein of unknown function called APP (for amyloid precursor protein). Genetic studies have shown that mutations that involve the genes coding for APP and for the enzymes that snip the Aβ off the end of the APP, lead to more production of Aβ, more amyloid formation, and are associated with increased susceptibility to Alzheimer’s disease. The story seems straightforward, then – more Aβ leads to more amyloid, and the resulting build-up of insoluble crud in the brain leads to Alzheimer’s disease. This is the “amyloid hypothesis”, in its simplest form.

    But things are not quite so simple. Although the genetic evidence linking Aβ to Alzheimer’s is strong, there are doubts about the mechanism. It turns out that the link between the presence of amyloid plaques themselves and the disease symptoms isn’t as strong as one might expect, so attention has turned to the possibility that it is the precursors to the full amyloid structure, where a handful of Aβ molecules come together to make smaller units – oligomers – which are the neurotoxic agents. Yet the mechanism by which these oligomers might damage the nerve cells remains uncertain.

    Nonetheless, the amyloid hypothesis has driven a huge amount of scientific effort, and it has motivated the development of a number of potential drugs, which aim to interfere in various ways with the processes by which Aβ has formed. These drugs have, so far without exception, failed to work. Between 2002 and 2012 there were 413 trials of drugs for Alzheimer’s; the failure rate was 99.6%. The single successful new drug – memantine – is a cognitive enhancer which can relieve some symptoms of Alzheimer’s, without modifying the cause of the disease. This represents a colossal investment of money – to be measured at least in the tens of billions of dollars – for no return so far.

    In November last year, Eli Lilly announced that its anti Alzheimer’s antibody, solanezumab, which was designed to bind to Aβ, failed to show a significant effect in phase 3 trials. After the failure of another phase III trial this February, of Merck’s beta-secretase inhibitor verubecestat, designed to suppress the production of Aβ, the medicinal chemist and long-time commentator on the pharmaceutical industry Derek Lowe wrote: “Beta-secretase inhibitors have failed in the clinic. Gamma-secretase inhibitors have failed in the clinic. Anti-amyloid antibodies have failed in the clinic. Everything has failed in the clinic. You can make excuses and find reasons – wrong patients, wrong compound, wrong pharmacokinetics, wrong dose, but after a while, you wonder if perhaps there might not be something a bit off with our understanding of the disease.”

    What is perhaps even more worrying is that the supply of drug candidates currently going through the earlier stages of the processes, phase 1 and phase 2 trials, looks like it is starting to dry up. A 2016 review of the Alzheimer’s drug pipeline concludes that there are simply not enough drugs in phase 1 trials to give hope that new treatments are coming through in enough numbers to survive the massive attrition rate we’ve seen in Alzheimer’s drug candidates (for a drug to get to market by 2025, it would need to be in phase 1 trials now). One has to worry that we’re running out of ideas.

    One way we can get a handle on the disease is to step back from the molecular mechanisms, and look again at the epidemiology. It’s clear that there are some well-defined risk factors for Alzheimer’s, which point towards some of the other things that might be going on, and suggest practical steps by which we can reduce the risks of dementia. One of these risk factors is type 2 diabetes, which according to data quoted by Taylor, increases the risk of dementia by 47%. Another is the presence of heart and vascular disease. The exact mechanisms at work here are uncertain, but on general principles these risk factors are not surprising. The human brain is a colossally energy-intensive organ, and anything that compromises the delivery of glucose and oxygen to its cells will place them under stress.

    One other risk factor that Taylor does not discuss much is air pollution. There is growing evidence (summarised, for example, in a recent article in Science magazine) that poor air quality – especially the sub-micron particles produced in the exhausts of diesel engines – is implicated in Alzheimer’s disease. It’s been known for a while that environmental nanoparticles such as the ultra-fine particulates formed in combustion can lead to oxidative stress, inflammation and thus cardiovascular disease (I wrote about this here more than ten years ago – Ken Donaldson on nanoparticle toxicology). The relationship between pollution and cardiovascular disease would by itself indicate an indirect link to dementia, but there is in addition the possibility of a more direct link, if, as seems possible, some of these ultra fine particles can enter the brain directly.

    There’s a fairly clear prescription, then, for individuals who wish to lower their risk of suffering from dementia in later life. They should eat well, keep their bodies and minds well exercised, and as much as possible breathe clean air. Since these are all beneficial for health in many other ways, it’s advice that’s worth taking, even if the links with dementia turn out to be less robust than they seem now.

    But I think we should be cautious about putting the emphasis entirely on individuals taking responsibility for these actions to improve their own lifestyles. Public health measures and sensible regulation has a huge role to play, and are likely to be very cost-effective ways of reducing what otherwise will be a very expensive burden of disease. It’s not easy to eat well, especially if you’re poor; the food industry needs to take more responsibility for the products it sells. And urban pollution can be controlled by the kind of regulation that leads to innovation – I’m increasingly convinced that the driving force for accelerating the uptake of electric vehicles is going to be pressure from cities like London and Paris, Los Angeles and Beijing, as the health and economic costs of poor air quality become harder and harder to ignore.

    Public health interventions and lifestyle improvements do hold out the hope of lowering the projected numbers of dementia sufferers from that figure of 2 million by 2051. But, for those who are diagnosed with dementia, we have to hope for the discovery of a breakthrough in treatment, a drug that does successfully slow or stop the progression of the disease. What needs to be done to bring that breakthrough closer?

    Firstly, we should stop overstating the progress we’re making now, and stop hyping “breakthroughs” that really are nothing of the sort. The UK’s newspapers seem to be particularly guilty of doing this. Take, for example, this report from the Daily Telegraph, headlined “Breakthrough as scientists create first drug to halt Alzheimer’s disease”. Contrast that with the reporting in the New York Times of the very same result – “Alzheimer’s Drug LMTX Falters in Final Stage of Trials”. Newspapers shouldn’t be in the business of peddling false hope.

    Another type of misguided optimism comes from Silicon Valley’s conviction that all is required to conquer death is a robust engineering “can-do” attitude. “Aubrey de Grey likes to compare the body to a car: a mechanic can fix an engine without necessarily understanding the physics of combustion”, a recent article on Silicon Valley’s quest to live for ever comments about the founder of the Valley’s SENS Foundation (the acronym is for Strategies for Engineered Negligible Senescence). Removing intercellular junk – amyloids – is point 6 in the SENS Foundation’s 7 point plan for eternal life.

    But the lesson of several hundred failed drug trials is that we do need to understand the science of dementia more before we can be confident of treating it. “More research is needed” is about the lamest and most predictable thing a scientist can ever say, but in this case it is all too true. Where should our priorities lie?

    It seems to me that hubristic mega-projects to simulate the human brain aren’t going to help at all here – they consider the brain at too high a level of abstraction to help disentangle the complex combination of molecular events that is disabling and killing nerve cells. We need to take into account the full complexity of the biological environments that nerve cells live in, surrounded and supported by glial cells like astrocytes, whose importance may have been underrated in the past. The new genomic approaches have already yielded powerful insights, and techniques for imaging the brain in living patients – magnetic resonance imaging and positron emission tomography – are improving all the time. We should certainly sustain the hope that new science will unlock new treatments for these terrible diseases, but we need to do the hard and expensive work to develop that science.

    In my own university, the Sheffield Institute for Translational Neuroscience focuses on motor neurone disease/ALS and other neurodegenerative diseases, under the leadership of an outstanding clinician scientist, Professor Dame Pam Shaw. The University, together with Sheffield’s hospital, is currently raising money for a combined MRI/PET scanner to support this and other medical research work. I’m taking part in one fundraising event in a couple of months with many other university staff – attempting to walk 50 miles in less than 24 hours. You can support me in this through this JustGiving page.

    Batteries and electric vehicles – disruption may come sooner than you think

    How fast can electric cars take over from fossil fuelled vehicles? This partly depends on how quickly the world’s capacity for manufacturing batteries – especially the lithium-ion batteries that are currently the favoured technology for all-electric vehicles – can expand. The current world capacity for manufacturing the kind of batteries that power electric cars is 34 GWh, and, as has been widely publicised, Elon Musk plans to double this number, with Tesla’s giant battery factory currently under construction in Nevada. This joint venture with Japan’s Panasonic will bring another 35 GWh capacity on stream in the next few years. But, as a fascinating recent article in the FT makes clear (Electric cars: China’s battle for the battery market), Tesla isn’t the only player in this game. On the FT’s figures, by 2020, it’s expected that there will be a total of 174 GWh battery manufacturing capacity in the world – an increase of more than 500%. Of this, no less than 109 GWh will be in China.

    What effect will this massive increase have on the markets? The demand for batteries – largely from electric vehicles – was for 11 GWh in 2015. Market penetration of electric vehicles is increasing, but it seems unlikely that demand will keep up with this huge increase in supply (one estimate projects demand in 2020 at 54 GWh). It seems inevitable that prices will fall in response to this coming glut – and batteries will end up being sold at less than the economically sustainable cost. The situation is reminiscent of what happened with silicon solar cells a few years ago – the same massive increase in manufacturing capacity, driven by China, resulting in big price falls – and the bankruptcy of many manufacturers.

    This recent report (PDF) from the US’s National Renewable Energy Laboratory helpfully breaks down some of the input costs of manufacturing batteries. Costs are lower in China than the USA, but labour costs form a relatively small part of this. The two dominating costs, by far, are the materials and the cost of capital. China has the advantage in materials costs by being closer to the centre of the materials supply chains, which are based largely in Korea, Japan and China – this is where a substantial amount of the value is generated.

    If the market price falls below the minimum sustainable price – as I think it must – most of the slack will be taken up by the cost of capital. Effectively, some of the huge capital costs going into these new plants will, one way or another, be written off – Tesla’s shareholders will lose even more money, and China’s opaque financial system will end up absorbing the losses. There will undoubtedly be manufacturing efficiencies to be found, and technical improvements in the materials, often arising from precise control of their nanostructure, will lead to improvements in the cost-effectiveness of the batteries. This will, in turn, accelerate the uptake of electric vehicles – possibly encouraged by strong policy steers in China especially.

    Even at relatively low relative penetration of electric vehicles relative to the internal combustion energy, in plausible scenarios (see for example this analysis from Imperial College’s Grantham Centre) they may displace enough oil to have a material impact on total demand, and thus keep a lid on oil prices, perhaps even leading to a peak in oil demand as early as 2020. This will upend many of the assumptions currently being made by the oil companies.

    But the dramatic fall in the cost of lithium-ion batteries that this manufacturing overcapacity will have other effects on the direction of technology development. It will create a strong force locking-in the technology of lithium-ion batteries – other types of battery will struggle to establish themselves in competition with this incumbent technology (as we have seen with alternatives to silicon photovoltaics), and technological improvements are most likely to be found in the kinds of material tweaks that can easily fit into the massive materials supply chains that are developing.

    To be parochial, the UK government has just trailed funding for a national research centre for battery technology. Given the UK’s relatively small presence in this area, and its distance from the key supply chains for materials for batteries, it is going to need to be very careful to identify those places where the UK is going to be in a position to extract value. Mass manufacture of lithium ion batteries is probably not going to be one of those places.

    Finally, why hasn’t John Goodenough (who has perhaps made the biggest contribution to the science of lithium-ion batteries in their current form) won the Nobel Prize for Chemistry yet?

    Trade, Power and Innovation

    Trade and its globalisation are at the top of the political agenda now. After decades in which national economies have become more and more entwined, populist politicians are questioning the benefits of globalisation. Meanwhile in the UK, we are embarked on a process of turning our backs on our biggest trading partner in the quest for a new set of global relationships, which, to listen to some politicians’ rhetoric, will bring back the days of Britain as a global trading giant. There’s no better time, then, to get some historical perspective on all this, so I’ve just finished reading Ronald Findlay & Kevin H. O’Rourke’s book Power and Plenty: Trade, War, and the World Economy in the Second Millennium – a world history of a millennium of trade globalisation.

    The history of world trade is one part of a history of world economic growth. Basic economics tells us that trade in itself leads to economic growth – communities that trade with each other on an equal basis mutually benefit, because they can each specialise in what they’re best at doing.

    But trade also drives innovation, the other mainspring of economic growth. The development of larger markets makes innovation worthwhile – the British industrial revolution would probably have fizzled out early if the new manufactured goods were restricted to home markets. Ideas and the technologies that are based on them diffuse along with traded goods. And the availability of attractive new imported goods creates demand and drives innovation to provide domestically produced substitutes. This was certainly the case in England in the 18th century, when the popularity of textiles from India and porcelain from China was so important in stimulating the domestic cotton and ceramics industries.

    This view of trade is fundamentally benign, but one of the key points of the book is to insist that in history, the opening up of trade has often been a very violent process – the plenty that trade brings has come from military power.

    The direct, organised,large-scale involvement of Western European powers in trade in the Far East was pioneered by the Dutch East India Company (VOC), formed in 1602. Continue reading “Trade, Power and Innovation”

    McLaren comes to Sheffield

    Last week saw the announcement that the high end car manufacturer McLaren Automotive is to open a new plant in Sheffield, to make the carbon fibre chassis assemblies for their sports cars. It was good to see that the extensive press reporting of this development (see e.g. the Guardian, the BBC and the FT (£) ) gave prominence to the role of the University of Sheffield’s Advanced Manufacturing Research Centre (AMRC) in attracting this investment. The production facility will be located adjacent to the AMRC, in what’s now a growing cluster of facilities for both production and research and development in various high value manufacturing sectors, and the expansion of the AMRC’s existing Composites Research Centre will support innovation in composites manufacturing technology. The focus in some news reports on the first McLaren apprentices, who will be trained in the AMRC Training Centre, is a nice illustration of the role of the AMRC in ensuring that McLaren will have the skilled people it needs.

    This investment has been a long time cooking, and I know how much work was put in by people at the AMRC, the Sheffield City Region LEP and Sheffield City Council to make it happen. A sceptic might ask, though, why is everyone getting so excited about a mere 200 new jobs? After all, a recent estimate suggested that to catch up with to the average UK performance, Sheffield City Region needed to find 70,000 new jobs, a good proportion of those being high-skilled, high paid roles.

    They are right to be excited; this illustrates some of the arguments I’ve been making about the importance of manufacturing. Sheffield, like most UK cities outside London and the South East, has a productivity problem; that means the focus of industrial strategy should not in the first instance be on bringing jobs to the region, but on bringing value. An investment by company like McLaren, which operates at the technological frontier in a very high value sector, has two beneficial effects. The direct effect is that by itself it brings value into the region, and the very high productivity jobs it provides by themselves will raise the average.

    But the indirect effects are potentially even more important. Sheffield, like other cities, has a problem of a very wide dispersion in productivity performance between the best firms in a sector like manufacturing, and a long tail of less productive firms. National and international evidence suggests that the gap between the technological leaders and the laggards is widening, and that this is a major ingredient of slowing productivity growth. The presence of technologically leading firms like McLaren will help the existing manufacturing business base in Sheffield to raise their game through access to more skilled people, through the expansion of shared research facilities such as AMRC, and through the demands McLaren will make on the firms that want to sell stuff to it.

    The McLaren investment, then, is an exemplar of the approach to regional industrial strategy we’ve been arguing for, for example in the Sheffield City Region/Lancashire Science and Innovation AuditDriving productivity growth through innovation in high value manufacturing. Our argument was we should develop open R&D facilities with a strong focus on translation, with very strong links both to the research base and to companies large and small, and we should focus on developing skills in a way that joined up the landscape from apprentice-level technical training of the highest quality, through degree and higher degree level education in technology and management. It’s for this reason that the University of Sheffield has created a large scale apprenticeship programme, in partnership with business and local FE colleges, through its AMRC Training Centre. This focus on innovation and skills, we argued, would have two effects – it would in itself improve the competitiveness of the existing business base, and it would attract inward investment from internationally leading companies new to the region.

    But to what end is all this skill and innovation being put? Environmentally conscious observers might wonder whether making petrol-guzzling super-cars for the super-rich should be our top priority. As someone whose interest in motor-sports is close to zero, I’m the wrong person to look to for enthusiasm for fast cars. I note that for the price of the cheapest model of McLaren sports car, I could buy more than a hundred of the cars I drive (2001 Toyota Yaris). The counter-argument, though, is that it’s in these very high end cars that innovative new technologies can be introduced; then as manufacturing experience is gained costs fall and scales increase to the point where the new technologies can be more widely available. The role of Tesla in accelerating the wider uptake electric vehicles is a good example of this.

    The technology McLaren will be developing is the use of composites. The driver here is reducing weight – weight is the key to fuel efficiency in both cars and aeroplanes, and carbon fibre is, for its weight, the strongest and stiffest material we know (carbon nanotubes and graphene feature the same sp2 carbon-carbon bonds, so are similar in stiffness, but could be stronger if they can be made with fewer defects, as I discussed a few years ago here). But carbon fibre composites are still not widely used outside the money-no-object domain of military aerospace; it’s expensive, both in terms of the basic materials cost, but perhaps more importantly in the cost of the manufacturing processes.

    The successful and most efficient use of carbon fibre composites also needs a very different design approach. When composites engineers talk about “black metal”, they’re not talking about dubious Nordic rock bands; it’s a derogatory term for a design approach which treats the composite as if it were a metal. But composites are fundamentally anisotropic – like a three dimensional version of a textile – and those properties should be not just taken account of but exploited to use the material to its full effect (as an old illustration of this, there’s a great story in Gordon’s New Science of Strong Materials about the way Madeleine Vionnet’s invention of the bias cut for dressmaking influenced post-war British missile design).

    It’s my hope, then, that McLaren’s arrival in Sheffield will make a difference to the local economy far greater than just through adding some jobs, positive though that is. It’s another major step in the revitalising of the high value manufacturing sector in our region.

    Steps towards an industrial strategy

    It’s impossible for a government to talk about industrial strategy in the UK without mentioning British Leyland, the auto conglomerate effectively nationalised after going bankrupt in 1975, and which finally expired in 2007. As everyone knows British Leyland illustrates the folly of governments “picking winners”, which inevitably produces outcomes like cars with square steering wheels. So it’s not surprising that the government’s latest discussion document Green Paper: Building our Industrial Strategy begins with a disclaimer – this isn’t a 1970’s industrial strategy, but a new vision, a modern industrial strategy that doesn’t repeat the mistakes of the past.

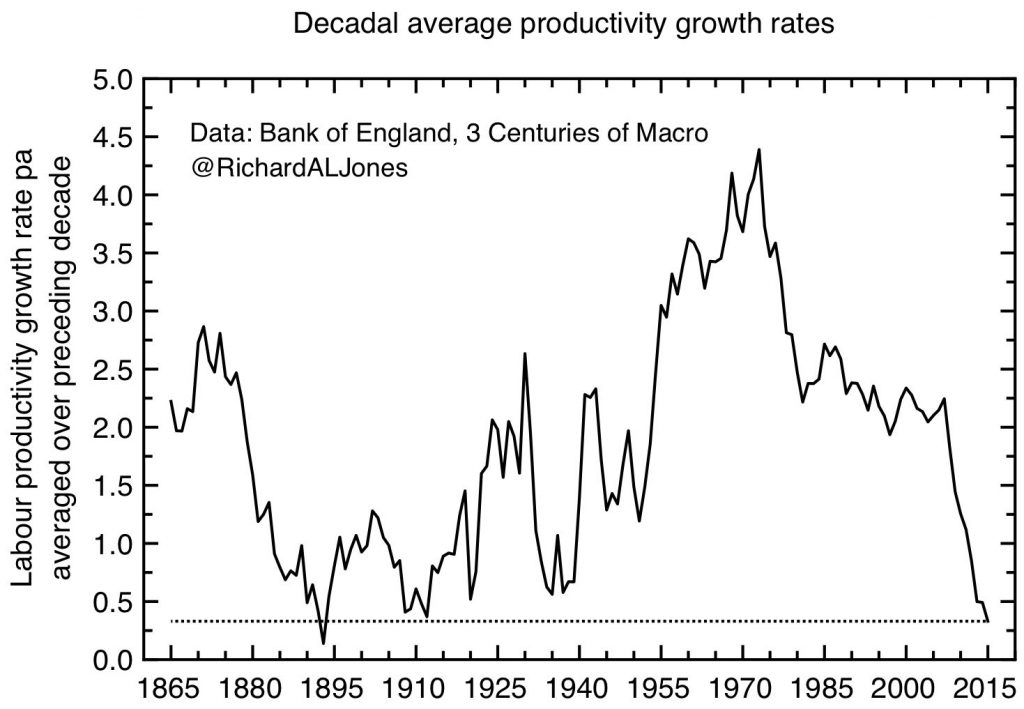
    The document isn’t actually a strategy yet, and it’s a stretch to describe much of it as new. But it is welcome, nonetheless; its analysis of the UK economy’s current position is much more candid and clear-sighted about its problems than previous government documents have felt able to be. Above all, the document focuses on the UK’s lamentable recent productivity performance (illustrated in the graph below), and the huge disparities between the performances of the UK’s different regional economies. It puts science and innovation as the first “pillar” of the strategy, and doesn’t pull punches about the current low levels of both government and private sector support for research.

    decadal productivity annotatedUK Productivity has grown less over the last ten years than over any previous decade since the late 19th century. Decadal average labour productivity growth, data from Thomas, R and Dimsdale, N (2016) “Three Centuries of Data – Version 2.3”, Bank of England

    It is a consultation document, and unlike many such, the questions don’t give the impression that the answer is already known – it does read as a genuine invitation to contribute to policy development. And what is very welcome indeed are the strong signals of high level political support: the document was launched by the Prime Minister, as “a critical part of our plan for post-Brexit Britain”, and as an exemplar of a new, active approach to government. This is in very sharp contrast to the signals coming out of the previous Conservative government.

    How should we judge the success of any industrial strategy? Again, the strategy is admirably clear about how it should be judged – the Secretary of State states the objective as being “to improve living standards and economic growth by increasing productivity and driving growth across the whole country.”

    I agree with this. There’s a corollary, though. Our existing situation – stagnant productivity growth, gross regional disparities in prosperity – tells us this – whatever we’ve been doing up to now, it hasn’t worked.

    Industrial strategy over the decades

    This is where it becomes important to look at what’s proposed in the light of what’s gone before. Continue reading “Steps towards an industrial strategy”