If new nuclear doesn’t get built, it will be fossil fuels, not renewables, that fill the gap

The UK’s programme to build a new generation of nuclear power stations is in deep trouble. Last month, Hitachi announced that it is pulling out of a project to build two new nuclear power stations in the UK; Toshiba had already announced last year that it was pulling out of the Moorside project.

The reaction to this news has been largely one of indifference. In one sense this is understandable – my own view is that it represents the inevitable unravelling of an approach to nuclear new build that was monumentally misconceived in the first place, maximising costs to the energy consumer while minimising benefits to UK industry. But many commentators have taken the news to indicate that nuclear power is no longer needed at all, and that we can achieve our goal of decarbonising our energy economy entirely on the basis of renewables like wind and solar. I think this argument is wrong. We should accelerate the deployment of wind and solar, but this is not enough for the scale of the task we face. The brutal fact is that if we don’t deploy new nuclear, it won’t be renewables that fill the gap, but more fossil fuels.

Let’s recall how much energy the UK actually uses, and where it comes from. In 2017, we used just over 2200 TWh. The majority of the energy we use – 1325 TWh – is in the form of directly burnt oil and gas. 730 TWh of energy inputs went in to produce the 350 TWh of electricity we used. Of that 350 TWh, 70 TWh came from nuclear, 61.5 TWh came from wind and solar, and another 6 TWh from hydroelectricity. Right now, our biggest source of low carbon electricity is nuclear energy.

But most of that nuclear power currently comes from the ageing fleet of Advanced Gas Cooled reactors. By 2030, all of our AGRs will be retired, leaving only Sizewell B’s 1.2 GW of capacity. In 2017, the AGRs generated a bit more than 60 TWh – by coincidence, almost exactly the same amount of electricity as the total from wind and solar.

The growth in wind and solar power in the UK in recent years has been tremendous – but there are two things we need to stress. Firstly, taking out the existing nuclear AGR fleet – as has to happen over the next decade – would entirely undo this progress, without nuclear new build. Secondly, in the context of the overall scale of the challenge of decarbonisation, the contribution of both nuclear and renewables to our total energy consumption remains small – currently less than 16%.

One very common response to this issue is to point out that the cost of renewables has now fallen so far that at the margin, it’s cheaper to bring new renewable capacity online than to build new nuclear. But this argument from marginal cost is only valid if you are only interested in marginal changes. If we’re happy with continuing to get around 80% of our energy from fossil fuels, then the marginal cost argument makes sense. But if we’re serious about making real progress towards decarbonisation – and I think the urgency of the climate change issue and the scale of the downside risks means we should be – then what’s important isn’t the marginal cost of low-carbon energy, but the whole system cost of replacing, not a few percent, but close to 100% of our current fossil fuel use.

So how much more wind and solar energy capacity can we realistically expect to be able to build? The obvious point here is that the total amount is limited – the UK is a small, densely populated, and not very sunny island – even in the absence of economic constraints, there are limits to how much of it can be covered in solar cells. And although its position on the fringes of the Atlantic makes it a very favourable location for offshore wind, there are not unlimited areas of the relatively shallow water that current offshore wind technology needs.

Currently, the current portfolio of offshore wind projects amounts to a capacity of 33.2 GW, with one further round of 7 GW planned. According to the most recent information I can find, “Industry says it could deliver 30GW installed by 2030”. If we assume the industry does a bit better than this, and delivers the entire current portfolio, that would produce about 120 TWh a year.

Solar energy produced 11.5 TWh in 2017. The very fast rate of growth that led us to that point has levelled off, due to changes in the subsidy regime. Nonetheless, there’s clearly room for further expansion, both of rooftop solar and grid scale installations. The most aggressive of the National Grid scenarios envisages a tripling of solar by 2030, to 32 TWh.

Thus by 2030, in the best case for renewables, wind and solar produce about 150 TWh of electricity, compared to our current total demand for electricity of 350 TWh. We can reasonably expect demand for electricity, all else equal, to slowly decrease as a result of efficiency measures. Estimating this by the long term rate of reduction of energy demand of 2% a year, we might hope to drive demand down to around 270 TWh by 2030. Where does that leave us? With all the new renewables, together with nuclear generation at its current level, we’d be generating 220 TWh out of 270 TWh. Adding on some biomass generation (currently about 35 TWh, much of which comes from burning environmentally dubious imported wood-chips), 6 TWh of hydroelectricity and some imported French nuclear power, and the job of decarbonising our electricity supply is nearly done. What would we do without the 70 TWh of nuclear power? We’d have to keep our gas-fired power stations running.

But, but, but… most of the energy we use isn’t in the form of electricity – it’s directly burnt gas and oil. So if we are serious about decarbonising the whole energy system, we need to be reducing that massive 1325 TWh of direct fossil fuel consumption. The most obvious way of doing that is by shifting from directly burning oil to using low-carbon electricity. This means that to get anywhere close to deep decarbonisation we are going to need to increase our consumption of electricity substantially – and then increase our capacity for low-carbon generation to match.

This is one driving force for the policy imperative to move away from internal combustion engines to electric vehicles. Despite the rapid growth of electric vehicles, we still use less than 0.2 TWh charging our electric cars. This compares with a total of 4.8 TWh of electricity used for transport, mostly for trains (at this point we should stop and note that we really should electrify all our mainline and suburban train-lines). But these energy totals are dwarfed by the 830 TWh of oil we burn in cars and trucks.

How rapidly can we expect to electrify vehicle transport? This is limited by economics, by the world capacity to produce batteries, by the relatively long lifetime of our vehicle stock, and by the difficulty of electrifying heavy goods vehicles. The most aggressive scenario looked at by the National Grid suggests electric vehicles consuming 20 TWh by 2030, a more than one-hundred-fold increase on today’s figures, representing 44% a year growth compounded. Roughly speaking, 1 TWh of electricity used in an electric vehicle displaces 3.25 TWh of oil – electric motors are much more efficient at energy conversion than internal combustion engines. So even at this aggressive growth rate, electric vehicles will only have displaced 8% of the oil burnt for transport. Full electrification of transport would require more than 250 TWh of new electricity generation, unless we are able to generate substantial new efficiencies.

Last, but not least, what of the 495 TWh of gas we burn directly, to heat our homes and hot water, and to drive industrial processes? A serious programme of home energy efficiency could make some inroads into this, we could make more use of ground source heat pumps, and we could displace some with hydrogen, generated from renewable electricity (which would help overcome the intermittency problem) or (in the future, perhaps) process heat from high temperature nuclear power stations. In any case, if we do decarbonise the domestic and industrial sectors currently dominated by natural gas, several hundred more TWh of electricity will be required.

So achieve the deep decarbonisation we need by 2050, electricity generation will need to be more than doubled. Where could that come from? A further doubling of solar energy from our already optimistic 2030 estimate might take that to 60 TWh. Beyond that, for renewables to make deep inroads we need new technologies. Marine technologies – wave and tide – have potential, but in terms of possible capacity deep offshore wind perhaps offers the biggest prize, with the Scottish Government estimating possible capacities up to 100 GW. But this is a new and untried technology, which will certainly be very much more expensive than current offshore wind. The problem of intermittency also substantially increases the effective cost of renewables at high penetrations, because of the need for large scale energy storage and redundancy. I find it difficult to see how the UK could achieve deep decarbonisation without a further expansion of nuclear power.

Coming back to the near future – keeping decarbonisation on track up to 2030 – we need to bring at least enough new nuclear on stream to replace the lost generation capacity of the AGR fleet, and preferably more, while at the same time accelerating the deployment of renewables. We need to be honest with ourselves about how little of our energy currently comes from low-carbon sources; even with the progress that’s been made deploying renewable electricity, most of our energy still arises from directly burning oil and gas. If we’re serious about decarbonisation, we need the rapid deployment of all low carbon energy sources.

And yet, our current policy for nuclear power is demonstrably failing. How should we do things differently, more quickly and at lower cost, to reboot the UK’s nuclear new build programme? That will be the subject of another post.

Notes on sources.
Current UK energy statistics are from the 2018 edition of the Digest of UK Energy Statistics.
Status of current and planned offshore wind capacity, from Crown Estates consultation.
National Grid future energy scenarios.
Oil displaced by electric vehicles – current estimates based on worldwide data, as reported by Bloomberg New Energy Finance.

What drives productivity growth in the UK economy?

How do you get economic growth? Economists have a simple answer – you can put in more labour, by having more people working for longer hours, or you can put in more capital, building more factories or buying more machines, or – and here things get a little more sketchy – you can find ways of innovating, of getting more outputs out of the same inputs. In the framework economists have developed for thinking about economic growth, the latter is called “total factor productivity”, and it is loosely equated with technological progress, taking this in its broadest sense. In the long run it is technological progress that drives improved living standards. Although we may not have a great theoretical handle on where total factor productivity comes from, its empirical study should tell us something important about the sources of our productivity growth. Or, in our current position of stagnation, why productivity growth has slowed down so much.

Of course, the economy is not a uniform thing – some parts of it may be showing very fast technological progress, like the IT industry, while other parts – running restaurants, for example, might show very little real change over the decades. These differences emerge from the sector based statistics that have been collected and analysed for the EU countries by the EU KLEMS Growth and Productivity Accounts database.

Sector percentage of 2015 economy by GVA contribution versus aggregate total factor productivity growth from 1998 to 2015. Data from EU KLEMS Growth and Productivity Accounts database.

Here’s a very simple visualisation of some key results of that data set for the UK. For each sector, the relative importance of the sector to the economy as a whole is plotted on the x-axis, expressed as a percentage of the gross value added of the whole economy. On the y-axis is plotted the total change in total factor productivity over the whole 17 year period covered by the data. This, then, is the factor by which that sector has produced more output than would be expected on the basis of additional labour and capital. This may tell us something about the relative effectiveness of technological progress in driving productivity growth in each of these sectors.

Broadly, one can read this graph as follows: the further right a sector is, the more important it is as a proportion of the whole economy, while the nearer the top a sector is, the more dynamic its performance has been over the 17 years covered by the data. Before a more detailed discussion, we should bear in mind some caveats. What goes into these numbers are the same ingredients as go into the measurement of GDP as a whole, so all the shortcomings of that statistic are potentially issues here.

A great starting point for understanding these issues is Diane Coyle’s book GDP: a brief but affectional history. The first set of issues concern what GDP measures and what it doesn’t measure. Lots of kinds of activity are important for the economy, but they only tend to count in GDP if money changes hands. New technology can shift these balances – if supermarkets replace humans at the checkouts by machines, the groceries still have to be scanned, but now the customer is doing the work for nothing.

Then there are some quite technical issues about how the measurements are done. This includes properly accounting for improvements in quality where technology is advancing very quickly; failing to fully account for the increased information transferred through a typical internet connection will mean that overall inflation will be overestimated, and productivity gains in the ICT will be understated (see e.g. A Comparison of Approaches to Deflating Telecoms Services Output, PDF). For some of the more abstract transactions in the modern economy – particularly in the banking and financial services sector, some big assumptions have to be made about where and how much value is added. For example, the method used to estimate the contribution of financial services – FISIM, for “Financial intermediation services indirectly measured” – has probably materially overstated the contribution of financial services to GDP by not handling risk correctly, as argued in this recent ONS article.

Finally, there’s the big question of whether increases in GDP correspond to increases in welfare. The general answer to this question is, obviously, not necessarily. Unlike some commentators, I don’t take this to mean that we shouldn’t take any notice of GDP – it is an important indicator of the health of an economy and its potential to supply people’s needs. But it does need looking at critically. A glazing company that spent its nights breaking shop windows and its days mending them would be increasing GDP, but not doing much for welfare – this is a ridiculous example, but there’s a continuum between what economist William Baumol called unproductive entrepreneurship, the more extractive varieties of capitalism documented by Acemoglu and Robinson – and outright organised crime.

To return to our plot, we might focus first on three dynamic sectors – information and communications, manufacturing, and professional, scientific, technical and admin services. Between them, these sectors account for a bit more than a quarter of the economy, and have shown significant improvements in total factor productivity over the period. In this sense it’s been ICT, manufacturing and knowledge-based services that have driven the UK economy over this period.

Next we have a massive sector that is important, but not yet dynamic, in the sense of having demonstrated slightly negative total factor productivity growth over the period. This comprises community, personal and social services – notably including education, health and social care. Of course, in service activities like health and social care it’s very easy to mischaracterise as a lowering of productivity a change that actually corresponds to an increase in welfare. On the other hand, I’ve argued elsewhere that we’ve not devoted enough attention to the kinds of technological innovation in health and social care sectors that could deliver genuine productivity increases.

Real estate comprises a sector that is both significant in size, and has shown significant apparent increases in total factor productivity. This is a point at which I think one should question the nature of the value added. A real estate business makes money by taking a commission on property transactions; hence an increase in property prices, given constant transaction volume, leads to an apparent increase in productivity. Yet I’m not convinced that a continuous increase in property prices represents the economy generating real value for people.

Finance and insurance represents a significant part of the economy – 7% – but its overall long term increase in total factor productivity is unimpressive, and probably overstated. The importance of this sector in thinking about the UK economy represents a distortion of our political economy.

The big outlier at the bottom left of the plot is mining and quarrying, whose total factor productivity has dropped by 50% – what isn’t shown is that its share of the economy has substantially fallen over the period too. The biggest contributor to this sector is North Sea oil, whose production peaked around 2000 and which has since been rapidly falling. The drop in total factor productivity does not, of course, mean that technological progress has gone backwards in this sector. Quite the opposite – as the easy oil fields are exhausted, more resource – and better technology – are required to extract what remains. This should remind us of one massive weakness in GDP as a sole measure of economic progress – it doesn’t take account of the balance sheet, of the non-renewable natural resources we use to create that GDP. The North Sea oil has largely gone now and this represents an ongoing headwind to the UK economy that will need more innovation in other sectors to overcome.

This approach is limited by the way the economy needs to be divided up into sectors. Of course, this sectoral breakdown is very coarse – within each sector there are likely to be outliers with very high total productivity growth which dramatically pull up the average of the whole sector. More fundamentally, it’s not obvious that the complex, networked nature of the modern economy is well captured by these rather rigid barriers. Many of the most successful manufacturing enterprises add big value to their products with the services that come attached to them, for example.

We can look into the EU Klems data at a slightly finer grained level; the next plot shows importance and dynamism for the various subsectors of manufacturing. This shows well the wide dispersions within the overall sectors – and of course within each of these subsectors there will be yet more dispersion.

Sub-sector fraction of 2015 economy by GVA contribution versus aggregate total factor productivity growth from 1998 to 2015 for subsectors of manufacturing. Data from EU KLEMS Growth and Productivity Accounts database.

The results are perhaps unsurprising – areas traditionally considered part of high value manufacturing – transport equipment and chemicals, which include aerospace, automotive, pharmaceuticals and speciality chemicals – are found in the top right quadrant, important in terms of their share of the economy, dynamic in terms of high total factor productivity growth. The good total factor productivity performance of textiles is perhaps more surprising, for an area often written off as part of our industrial heritage. It would be interesting to look in more detail at what’s going on here, but I suspect that a big part of it could be the value that can be added by intangibles like branding and design. Total factor productivity is not just about high tech and R&D, important though the latter is.

Clearly this is a very superficial look at a very complicated area. Even within the limitations of the EU Klems data set, I’ve not considered how rates of TFP growth have varied by time – before and after the global financial crisis, for example. Nor have I considered the way shifts between sectors have contributed to overall changes in productivity across the economy – I’ve focused only on rates, not on starting levels. And of course, we’re talking here about history, which isn’t always a good guide to the future, where there will be a whole new set of technological opportunities and competitive challenges. But as we start to get serious about industrial strategy, these are the sorts of questions that we need to be looking into.

Innovation, regional economic growth, and the UK’s productivity problem

A week ago I gave a talk with this title at a conference organised by the Smart Specialisation Hub. This organisation was set up to help regional authorities in developing their economic plans; given the importance of local industrial strategies in the government’s overall industrial strategy its role becomes all the more important.

Other speakers at the conference represented central government, the UK’s innovation agency InnovateUK, and the Smart Specialisation Hub itself. Representing no-one but myself, I was able to be more provocative in my own talk, which you can download here (PDF, 4.7 MB).

My talk had four sections. Opening with the economic background, I argued that the UK’s stagnation in productivity growth and regional economic inequality has broken our political settlement. Looking at what’s going on in Westminster at the moment, I don’t think this is an exaggeration.

I went on to discuss the implications of the 2.4% R&D target – it’s not ambitious by developed world standards, but will be a stretch from our current position, as I discussed in an earlier blogpost: Reaching the 2.4% R&D intensity target.

Moving on to the regional aspects of research and innovation policy, I argued (as I did in this blog post: Making UK Research and Innovation work for the whole UK) that the UK’s regional concentration of R&D (especially public sector) is extreme and must be corrected. To illustrate this point, I used this version of Tom Forth’s plot splitting out the relative contributions of public and private sector to R&D regionally.

I argued that this plot gives a helpful framework for thinking about the different policy interventions needed in different parts of the country. I summarised this in this quadrant diagram [1].

Finally, I discussed the University of Sheffield’s Advanced Manufacturing Research Centre as an example of the kind of initiative that can help regenerate the economy of a de-industrialised area. Here a focus on translational research & skills at all levels both drives inward investment by international firms at the technology frontier & helps the existing business base upgrade.

I set this story in the context of Shih and Pisano’s notion of the “industrial commons” [2] – a set of resources that supports the collective knowledge, much of it tacit, that drives innovations in products and processes in a successful cluster. A successful industrial commons is rooted in a combination of large anchor companies & institutions, networks of supplying companies, R&D facilities, informal knowledge networks and formal institutions for training and skills. I argue that a focus of regional economic policy should be a conscious attempt to rebuild the “industrial commons” in an industrial sector which allows the opportunities of new technology to be embraced, yet which works with grain of the existing industry and institutional base. The “smart specialisation” framework is a good framework for identifying the right places to look.

1. As a participant later remarked, I’ve omitted the South East from this diagram – it should be in the bottom right quadrant, albeit with less business R&D than East Anglia, though with the benefits more widely spread.

2. See Pisano, G. P., & Shih, W. C. (2009). Restoring American Competitiveness. Harvard Business Review, 87(7-8), 114–125.

The semiconductor industry and economic growth theory

In my last post, I discussed how “econophysics” has been criticised for focusing on exchange, not production – in effect, for not concerning itself with the roots of economic growth in technological innovation. Of course, some of that technological innovation has arisen from physics itself – so here I talk about what economic growth theory might learn from an important episode of technological innovation with its origins in physics – the development of the semiconductor industry.

Economic growth and technological innovation

In my last post, I criticised econophysics for not talking enough about economic growth – but to be fair, it’s not just econophysics that suffers from this problem – mainstream economics doesn’t have a satisfactory theory of economic growth either. And yet economic growth and technological innovation provides an all-pervasive background to our personal economic experience. We expect to be better off than our parents, who were themselves better off than our grandparents. Economics without a theory of growth and innovation is like physics without an arrow of time – a marvellous intellectual construction that misses the most fundamental observation of our lived experience.

Defenders of economics at this point will object that it does have theories of growth, and there are even some excellent textbooks on the subject [1]. Moreover, they might remind us, wasn’t the Nobel Prize for economics awarded this year to Paul Romer, precisely for his contribution to theories of economic growth? This is indeed so. The mainstream approach to economic growth pioneered by Robert Solow regarded technological innovation as something externally imposed, and Romer’s contribution has been to devise a picture of growth in which technological innovation arises naturally from the economic models – the “post-neoclassical endogenous growth theory” that ex-Prime Minister Gordon Brown was so (unfairly) lampooned for invoking.

This body of work has undoubtedly highlighted some very useful concepts, stressing the non-rivalrous nature of ideas and the economic basis for investments in R&D, especially for the day-to-day business of incremental innovation. But it is not a theory in the sense a physicist might understand that – it doesn’t explain past economic growth, so it can’t make predictions about the future.

How the information technology revolution really happened

Perhaps to understand economic growth we need to turn to physics again – this time, to the economic consequences of the innovations that physics provides. Few would disagree that a – perhaps the – major driver of technological innovation, and thus economic growth, over the last fifty years has been the huge progress in information technology, with the exponential growth in the availability of computing power that is summed up by Moore’s law.

The modern era of information technology rests on the solid-state transistor, which was invented by William Shockley at Bell Labs in the late 1940’s (with Brattain and Bardeen – the three received the 1956 Nobel Prize for Physics). In 1956 Shockley left Bell Labs and went to Palo Alto (in what would later be called Silicon Valley) to found a company to commercialise solid-state electronics. However, his key employees in this venture soon left – essentially because he was, by all accounts, a horrible human being – and founded Fairchild Semiconductors in 1957. Key figures amongst those refugees were Gordon Moore – of eponymous law fame – and Robert Noyce. It was Noyce who, in 1960, made the next breakthrough, inventing the silicon integrated circuit, in which a number of transistors and other circuit elements were combined on a single slab of silicon to make a integrated functional device. Jack Kilby, at Texas Instruments, had, more or less at the same time, independently developed an integrated circuit on germanium, for which he was awarded the 2000 Physics Nobel prize (Noyce, having died in 1990, was unable to share this). Integrated circuits didn’t take off immediately, but according to Kilby it was their use in the Apollo mission and the Minuteman ICBM programme that provided a turning point in their acceptance and widespread use[2] – the Minuteman II guidance and control system was the first mass produced computer to rely on integrated circuits.

Moore and Noyce founded the electronics company Intel in 1968, to focus on developing integrated circuits. Moore had already, in 1965, formulated his famous law about the exponential growth with time of the number of transistors per integrated circuit. The next step was to incorporate all the elements of a computer on a single integrated circuit – a single piece of silicon. Intel duly produced the first commercially available microprocessor – the 4004 – in 1971, though this had been (possibly) anticipated by the earlier microprocessor that formed the flight control computer for the F14 Tomcat fighter aircraft. From these origins emerged the microprocessor revolution and personal computers, with its giant wave of derivative innovations, leading up to the current focus on machine learning and AI.

Lessons from Moore’s law for growth economics

What should clear from this very brief account is that classical theories of economic growth cannot account for this wave of innovation. The motivations that drove it were not economic – they arose from a powerful state with enormous resources at its disposal pursuing complex, but entirely non-economic projects – such as the goal of being able to land a nuclear weapon on any point of the earth’s surface with an accuracy of a few hundred meters.

Endogenous growth theories perhaps can give us some insight into the decisions companies made about R&D investment and the wider spillovers that such spending led to. They would need to take account of the complex institutional landscape that gave rise to this innovation. This isn’t simply a distinction between public and private sectors – the original discovery of the transistor was made at Bell Labs – nominally in the private sector, but sustained by monopoly rents arising from government action.

The landscape in which this innovation took place seems much more complex than growth economics, with its array of firms employing undifferentiated labour, capital, all benefiting from some kind of soup of spillovers seems able to handle. Semiconductor fabs are perhaps the most capital intensive plants in the world, with just a handful of bunny-suited individuals tending a clean-room full of machines that individually might be worth tens or even hundreds of millions of dollars. Yet the value of those machines represents, as much as anything physical, the embodied value of the intangible investments in R&D and process know-how.

How are the complex networks of equipment and materials manufacturers coordinated to make sure technological advances in different parts of this system happen at the right time and in the right sequence? These are independent companies operating in a market – but the market alone has not been sufficient to transmit the information needed to keep it coordinated. An enormously important mechanism for this coordination has been the National Technology Roadmap for Semiconductors (later the International Technology Roadmap for Semiconductors), initiated by a US trade body, the Semiconductor Industry Association. This was an important social innovation which allowed companies to compete in meeting collaborative goals; it was supported by the US government by the relaxation of anti-trust law and the foundation of a federally funded organisation to support “pre-competitive” research – SEMATECH.

The involvement of the US government reflected the importance of the idea of competition between nation states in driving technological innovation. Because of the cold war origins of the integrated circuits, the original competition was with the Soviet Union, which created an industry to produce ICs for military use, based around Zelenograd. The degree to which this industry was driven by indigenous innovation as against the acquisition of equipment and know-how from the west isn’t clear to me, but it seems that by the early 1980’s the gap between Soviet and US achievements was widening, contributing to the sense of stagnation of the later Brezhnev years and the drive for economic reform under Gorbachev.

From the 1980’s, the key competitor was Japan, whose electronics industry had been built up in the 1960’s and 70’s driven not by defense, but by consumer products such as transistor radios, calculators and video recorders. In the mid-1970’s the Japanese government’s MITI provided substantial R&D subsidies to support the development of integrated circuits, and by the late 1980’s Japan appeared within sight of achieving dominance, to the dismay of many commentators in the USA.

That didn’t happen, and Intel still remains at the technological frontier. Its main rivals now are Korea’s Samsung and Taiwan’s TSMC. Their success reflects different versions of the East Asian developmental state model; Samsung is Korea’s biggest industrial conglomerate (or chaebol), whose involvement in electronics was heavily sponsored by its government. TSMC was a spin-out from a state-run research institute in Taiwan, ITRI, which grew by licensing US technology and then very effectively driving process improvements.

Could one build an economic theory that encompasses all this complexity? For me, the most coherent account has been Bill Janeway’s description of the way government investment combines with the bubble dynamics that drives venture capitalism, in his book “Doing Capitalism in the Innovation Economy”. Of course, the idea that financial bubbles are important for driving innovation is not new – that’s how the UK got a railway network, after all – but the econophysicist Didier Sornette has extended this to introduce the idea of a “social bubble” driving innovation[3].

This long story suggests that the ambition of economics to “endogenise” innovation is a bad idea, because history tells us that the motivations for some of the most significant innovations weren’t economic. To understand innovation in the past, we don’t just need economics, we need to understand politics, history, sociology … and perhaps even natural science and engineering. The corollary of this is that devising policy solely on the basis of our current theories of economic growth is likely to lead to disappointing outcomes. At a time when the remarkable half-century of exponential growth in computing power seems to be coming to an end, it’s more important than ever to learn the right lessons from history.

[1] I’ve found “Introduction to Modern Economic Growth”, by Daron Acemoglu, particularly useful

[2] Jack Kilby: Nobel Prize lecture, https://www.nobelprize.org/uploads/2018/06/kilby-lecture.pdf

[3] See also that great authority, The Onion “Recession-Plagued Nation Demands New Bubble to Invest In

The Physics of Economics

This is the first of two posts which began life as a single piece with the title “The Physics of Economics (and the Economics of Physics)”. In the first section, here, I discuss some ways physicists have attempted to contribute to economics. In the second half, I turn to the lessons that economics should learn from the history of a technological innovation with its origin in physics – the semiconductor industry.

Physics and economics are two disciplines which have quite a lot in common – they’re both mathematical in character, many of their practitioners are not short of intellectual self-confidence – and they both have imperialist tendencies towards their neighbouring disciplines. So the interaction between the two fields should be, if nothing else, interesting.

The origins of econophysics

The most concerted attempt by physicists to colonise an area of economics is in the area of the behaviour of financial markets – in the field which calls itself “econophysics”. Actually at its origins, the traffic went both ways – the mathematical theory of random walks that Einstein developed to explain the phenomenon of Brownian motion had been anticipated by the French mathematician Bachelier, who derived the theory to explain the movements of stock markets. Much later, the economic theory that markets are efficient brought this line of thinking back into vogue – it turns out that financial markets can be quite often modelled as simple random walks – but not quite always. The random steps that markets take aren’t drawn from a Gaussian distribution – the distribution has “fat tails”, so rare events – like big market crashes – aren’t anywhere like as rare as simple theories assume.

Empirically, it turns out that the distributions of these rare events can sometimes be described by power laws. In physics power laws are associated with what are known as critical phenomena – behaviours such as the transition from a liquid to a gas or from a magnet to a non-magnet. These phenomena are characterised by a certain universality, in the sense that the quantitative laws – typically power laws – that describe the large scale behaviour of these systems doesn’t strongly depend on the details of the individual interactions between the elementary objects (the atoms and molecules, in the case of magnetism and liquids) whose interaction leads collectively to the larger scale phenomenon we’re interested in.

For “econophysicists” – whose background often has been in the study of critical phenomenon – it is natural to try and situate theories of the movements of financial markets in this tradition, finding analogies with other places where power laws can be found, such as the distribution of earthquake sizes and the behaviour of sand-piles. In terms of physicists’ actual impact on participants in financial markets, though, there’s a paradox. Many physicists have found (often very lucrative) employment as quantitative traders, but the theories that academic physicists have developed to describe these markets haven’t made much impact on the practitioners of financial economics, who have their own models to describe market movements.

Other ideas from physics have made their way into discussions about economics. Much of classical economics depends on ideas like the “representative household” or the “representative firm”. Physicists with a background in statistical mechanics recognise this sort of approach as akin to a “mean field theory”. The idea that a complex system is well represented by its average member is one that can be quite fruitful, but in some important circumstances fails – and fails badly – because the fluctuations around the average become as important as the average itself. This motivates the idea of agent based models, to which physicists bring the hope that even simple “toy” models can bring insight. The Schelling model is one such very simple model that came from economics, but which has a formal similarity with some important models in physics. The study of networks is another place where one learns that the atypical can be disproportionately important.

If markets are about information, then physics should be able to help…

One very attractive emerging application of ideas from physics to economics concerns the place of information. Friedrich Hayek stressed the compelling insight that one can think of a market as a mechanism for aggregating information – but a physicist should understand that information is something that can be quantified, and (via Shannon’s theory) that there are hard limits on how much information can transmitted in a physical system . Jason Smith’s research programme builds on this insight to analyse markets in terms of an information equilibrium[1].

Some criticisms of econophysics

How significant is econophysics? A critique from some (rather heterodox) economists – Worrying trends in econophysics – is now more than a decade old, but still stings (see also this commentary from the time from Cosma Shalizi – Why Oh Why Can’t We Have Better Econophysics? ). Some of the criticism is methodological – and could be mostly summed up by saying, just because you’ve got a straight bit on a log-log plot doesn’t mean you’ve got a power law. Some criticism is about the norms of scholarship – in brief: read the literature and stop congratulating yourselves for reinventing the wheel.

But the most compelling criticism of all is about the choice of problem that econophysics typically takes. Most attention has been focused on the behaviour of financial markets, not least because these provide a wealth of detailed data to analyse. But there’s more to the economy – much, much more – than the financial markets. More generally, the areas of economics that physicists have tended to apply themselves to have been about exchange, not production – studying how a fixed pool of resources can be allocated, not how the size of the pool can be increased.

[1] For a more detailed motivation of this line of reasoning, see this commentary, also from Cosma Shalizi on Francis Spufford’s great book “Red Plenty” – “In Soviet Union, Optimization Problem Solves You”.

Productivity: in R&D, healthcare and the whole economy

This is a slightly adapted extract from The Biomedical Bubble: Why UK research and innovation needs a greater diversity of priorities, politics, places and people, my report for NESTA, with James Wilsdon.

Productivity is a measure of the efficiency with which inputs are converted into outputs of value – increasing productivity lets us get more from less. We talk about different kinds of productivity in our report:

● Economic productivity, at the level of the nation, regions and industry sectors, most usefully expressed as labour productivity;
● R&D productivity: the effectiveness with which research and development expenditure translates into new products and processes and thus economic value;
● Healthcare productivity: the effectiveness with which given inputs of money and labour produce improved health outcomes.

The UK’s productivity problem

The performance of the whole national economy is measured by labour productivity – the value of the goods and services (as measured by GDP) produced by an (average) hour of work. Increases in labour productivity arise from a combination of capital investment and technological progress, and are the fundamental drivers of economic growth and increasing living standards.


Labour productivity since 1970. ONS, January 2018 release.

Labour productivity in the UK has stagnated since the global financial crisis of 2007/8 : currently it’s some 15-20% below what would be expected if the pre-crisis trend had continued, the worst performance for at least a century . It’s this stagnation of labour productivity that sets our overall economic environment, leading directly to wage stagnation and a persistently challenging fiscal situation for the government, which has responded with sustained austerity.

The overall labour productivity of the economy is an aggregate; we can decompose it to consider the contribution of different geographical regions or industry sectors. A regional breakdown reveals how geographically unbalanced the UK economy is. London dominates, with labour productivity 33% above the UK average. Of the other regions, only the South East is above the national average. Wales and Northern Ireland are 17% below the UK average, with other regions in the English North and Midlands between 7 and 15% below average.

The pharmaceutical industry’s contribution to overall productivity growth – from leader to laggard

There’s a very wide dispersion of labour productivity across industrial sectors. In understanding their contribution to the overall productivity puzzle, it’s important to consider both the level of labour productivity and the rate of growth. The pharmaceutical industry is particularly important to the UK here – its level of labour productivity is very high, so even though it only constitutes a relatively small part of the overall economy, shifts in its performance can have a material effect on the whole economy.

But recent years have seen a big fall in the rate of growth of labour productivity in the pharmaceutical industry [1]. Between 1999 and 2007, labour productivity in the pharmaceutical industry grew by 9.7% a year – this excellent performance made a material difference to the whole economy, contributing 0.11 percentage points to the total annual labour productivity growth in the pre-crisis economy of 2.8%. But between 2008 and 2015, labour productivity in pharma actually shrank by 11% a year, dragging down labour productivity growth in the whole economy.

The origins of the pharmaceutical industry’s productivity problem – falling R&D productivity

Labour productivity gains arise from the introduction of new, high value, products and improved processes. In the pharmaceutical industry, new products are created by research and development (R&D), with their value being protected by patents.

R&D productivity expresses the efficiency with which R&D produces value through new products and processes. This can be difficult to quantify: a new drug is the product of perhaps 15 years of R&D and for each successful drug produced many candidates fail. One simple measure is the number of new drugs produced for a given value of R&D; as the graph shows, on this measure R&D productivity has fallen substantially over the decades.


Exponentially falling R&D productivity in the pharmaceutical industry worldwide. Number of new molecules approved by FDA (pharma and biotech) per $bn global R&D spending. Plot after Scannell et al [2], with additional post-2012 data courtesy of Jack Scannell.

Falling R&D productivity explains falling labour productivity in pharmaceuticals, with a lag time that expresses the time it takes to develop and test new drugs. This will be exacerbated if the total volume of R&D falls as well, as it has begun to do in recent years.

The recent weak performance of the UK economy can be linked in part to its low overall R&D intensity , and this has been recognised by the government’s commitment to raise this to 2.4% of GDP. As I described in an earlier post – Making UK Research and Innovation work for the whole UK – R&D intensity varies strongly across the country, with these variations being correlated with regional economic performance. The commitment to raise the overall R&D intensity of the UK economy is welcome, but it will only deliver the hoped-for economic benefits if overall R&D productivity across all sectors can be maintained or increased.

Healthcare productivity – the pressure for improvements

The purpose of health-related research and development is not simply economic, however. We hope that research will improve people’s lives, reducing mortality and morbidity.

But we can’t avoid the economic dimension of healthcare either – the pressures on health service budgets are all too obvious in this time of continuing public austerity, so the idea that innovation – technological, social and organisational – can allow us to achieve the same or better healthcare outcomes for less money is compelling.

Healthcare productivity can be estimated by comparing inputs – labour, goods and services and capital expenditure – with some measure of the amount of treatment delivered. This needs to be adjusted for improved quality of care – for example, from improved survival rates, and measures of patient satisfaction. The ONS produces estimates of quality adjusted public service healthcare productivity , which show an average increase of 0.8% a year, between 1995 – 2015.

The context for this continuous improvement in healthcare productivity is an even larger increase in demand for healthcare . For example, between 2003/4 and 2015/16 there was an average annual rise in hospital admissions a year, driven by demographic changes – in particular – a 40% rise in the number of people aged 85 and over.

This demand pressure is likely to continue into the future, so without further increases in healthcare productivity, quality will suffer and costs will rise.

Labour productivity, R&D productivity, healthcare productivity – the vicious circle and how to break out of it

These three aspects of productivity are linked. Falling R&D productivity in pharmaceuticals has led to falling labour productivity in that industry. That in turn has made a material contribution to stagnant labour productivity across the whole economy. On the other hand, stagnant labour productivity in the whole economy has produced a government response of continuing austerity, putting pressure on health service budgets, and increasing the demand for improved healthcare productivity.

How can we break out of this trap? Improving the effectiveness and targeting of our R&D effort has to be central to this. Better R&D productivity will lead to improvements in labour productivity in pharmaceuticals, biotechnology and medical technology across the whole country, leading to sustained, geographically balanced economic growth. And if we do the right R&D to deliver improved healthcare productivity, that will lead to better health outcomes for everyone.

1. R. Riley, A. Rincon-Aznar, L. Samek, Below the Aggregate: A Sectoral Account of the UK Productivity Puzzle, ESCoE Discussion Papaer 2018-6 (May 2018)
https://www.escoe.ac.uk/wp-content/uploads/2018/05/ESCoE-DP-2018-06.pdf

2. Scannell, J. W., Blanckley, A., Boldon, H., & Warrington, B. (2012). Diagnosing the decline in pharmaceutical R&D efficiency, 1–10. http://doi.org/10.1038/nrd3681

More on the biomedical bubble

A couple more pieces reacting to my report for NESTA, with James Wilsdon – The Biomedical Bubble: Why UK research and innovation needs a greater diversity of priorities, politics, places and people.

The climate change activist Alice Bell picks up on a renewable energy aspect to the theme of research prioritisation, asking on the Guardian’s blog Is UK science and innovation up for the climate challenge?. “The government has shaken up the UK research system. But fossil fuels, not low-carbon technologies, still seem to be in the driving seat.”

The Financial Times picked up the report; an opinion piece from its science correspondent Anjana Ahuja says Britain must stop inflating the biomedical bubble (subscription required). “The drugs sector receives funding out of all proportion to the results it delivers.”

Reaching the 2.4% R&D intensity target

I had a rather difficult and snowy journey to London yesterday to give evidence to the House of Commons Business, Energy and Industrial Select Committee (video here, from 11.10). The subject was Industrial Strategy, and I was there as a member of the Industrial Strategy Commission, whose final report was published last November.

One of the questions I was asked was about the government’s new target of achieving an overall R&D intensity of 2.4% of GDP by 2027, as set out in its recent Industrial Strategy White Paper. Given that our starting point is about 1.7%, where it has been stuck for many years, was this target achievable? I replied a little non-committally. I’d reminded the committee about the long term fall in the UK’s R&D intensity since 1980, and the failure of what I’ve called “supply side innovation policy”, as I discussed at length in my paper The UK’s innovation deficit and how to repair it, which also highlights earlier governments’ failure to meet similar targets in the past. But it’s worth looking in more detail at the scale of the ambition here. My plot shows actual R&D spending up to 2015, and then the growth that would be required to achieve a 2.4% target.


R&D expenditure in the UK, adjusted for inflation. Data points show actual expenditure up to 2015 (source: ONS GERD statistics, March 2017 release), the lines are the projections of the growth that would be required to meet a target of 2.4% by 2027. Solid lines assume that GDP grows according to the latest predictions of the Office of Budgetary Responsibility up to 2022, and then at 1.6% pa thereafter. Dotted lines assume no growth in GDP at all.

One obvious point (and drawback) about expressing the target as a percentage of GDP is the worse the economy does, the less demanding the target is. I’ve taken account of this effect by modelling two scenarios. In the first one, I’ve assumed the rates of growth predicted out to 2022 by the Office of Budgetary Responsibility in their latest forecasts. These are not particularly optimistic, predicting annual growth rates in the range 1.3% – 1.8%; after 2022 I’ve assumed a constant growth rate of 1.6%, their final forecast value. In the second, I’ve assumed no growth in GDP at all. One hopes that this is a lower bound. In both cases, I’ve assumed that the overall balance between public and private sector funding for R&D remains the same.

Assuming the modest growth scenario, this means that total R&D spending needs to increase by £22 billion (41%) between 2015 and 2027, from £32 billion to £54 billion . To put this into perspective, between 2004 and 2015 spending increased by £6.6 billion (26%) in the 11 years from 2004 to 2015.

Some of this spending is directly controlled by the government. My plot splits the spending by where the research is carried out – in 2015, research in government and research council laboratories and in the universities amounted to one third of the total – £10.7 billion. This would need to increase by £7.4 billion.

As the plot shows, the government’s part of R&D has been essentially flat since 2004. The government has announced in the Autumn budget R&D increases amounting to £2.3 billion by 2021-2022. This is significant, but not enough – it would need to be more like £3.5 billion to meet the trajectory to the target. There is of course an issue about whether the research capacity of the UK is sufficient to absorb sums of this magnitude, and indeed whether we have the ability to make sensible choices about spending it.

But most of the spending is not in the control of the government – it happens in businesses. This needs to rise by about £14 billion, from £21 billion to £35 billion.

How could that happen? Graham Reid has set this out in an excellent article. There are essentially three options: existing businesses could increase their R&D, entirely new R&D intensive businesses could be created, and overseas companies could be persuaded to locate R&D facilities in the UK.

How can the government influence these decisions? One way is through direct subsidy, and it is perhaps not widely enough appreciated how much the government already does this. The R&D tax credit is essentially an indiscriminate subsidy for private sector R&D, whose value currently amounts to £2.9 billion. Importantly, this does not form part of the science budget. More targeted subsidies for private sector R&D come through collaborative research sponsored through InnovateUK (and, for the moment at least, the EU’s Framework Programme). In addition, private sector R&D can be supported indirectly through the provision of translational R&D centres whose costs are shared between government and industry, like Germany’s Fraunhofer Institutes. The UK’s Catapult Centres are an attempt to fill this gap, though on a scale that is as yet much too small.

Business R&D did slowly increase in real terms between 2004 and 2015. It is important to realise, though, that these gradual shifts in the aggregate figure conceal some quite big swings at a sector level.


R&D expenditure in selected sectors, from the November 2017 ONS BERD release. Figures have been adjusted to 2016 constant £s using GDP deflators.

This is illustrated in my second plot, showing inflation corrected business R&D spend from selected sectors. This shows the dramatic fall in pharmaceutical R&D – more than £1 billion, or 22% – from its 2011 peak, and the even more dramatic increase in automotive R&D – £2.5 billion, or 274%, from its 2006 low point. We need to understand what’s behind these swings in order to design policy to support R&D in each sector.

So, is the 2.4% target achievable? Possibly, and it’s certainly worth trying. But I don’t think we know how to do it now. The challenge to industrial strategy and science and innovation policy is to change that.

An intangible economy in a material world

Thirty years ago, Kodak dominated the business of making photographs. It made cameras, sold film, and employed 140,000 people. Now Instagram handles many more images than Kodak ever did, but when it was sold to Facebook in 2012, it employed 13 people. This striking comparison was made by Jaron Lanier in his book “You are not a gadget”, to stress the transition we have made to world in which value is increasingly created, not from plant and factories and manufacturing equipment, but from software, from brands, from business processes – in short, from intangibles. The rise of the intangible economy is the theme of a new book by Jonathan Haskel and Stian Westlake, “Capitalism without Capital”. This is a marvellously clear exposition of what makes investment in intangibles different from investment in the physical capital of plant and factories.

These differences are summed up in a snappily alliterative four S’s. Intangible assets are scalable: having developed a slick business process for selling over-priced coffee, Starbucks could very rapidly expand all over the world. The costs of developing intangible assets are sunk – having spent a lot of money building a brand, if the business doesn’t work out it’s much more difficult to recover much of those costs than it would be to sell a fleet of vans. And intangibles have spillovers – despite best efforts to protect intellectual property and keep the results secret, the new knowledge developed in a company’s research programme inevitably leaks out, benefitting other companies and society at large in ways that the originating firm can’t benefit from. And intangibles demonstrate synergies – the value of many ideas together is usually greater – often very much greater – than the sum of the parts.

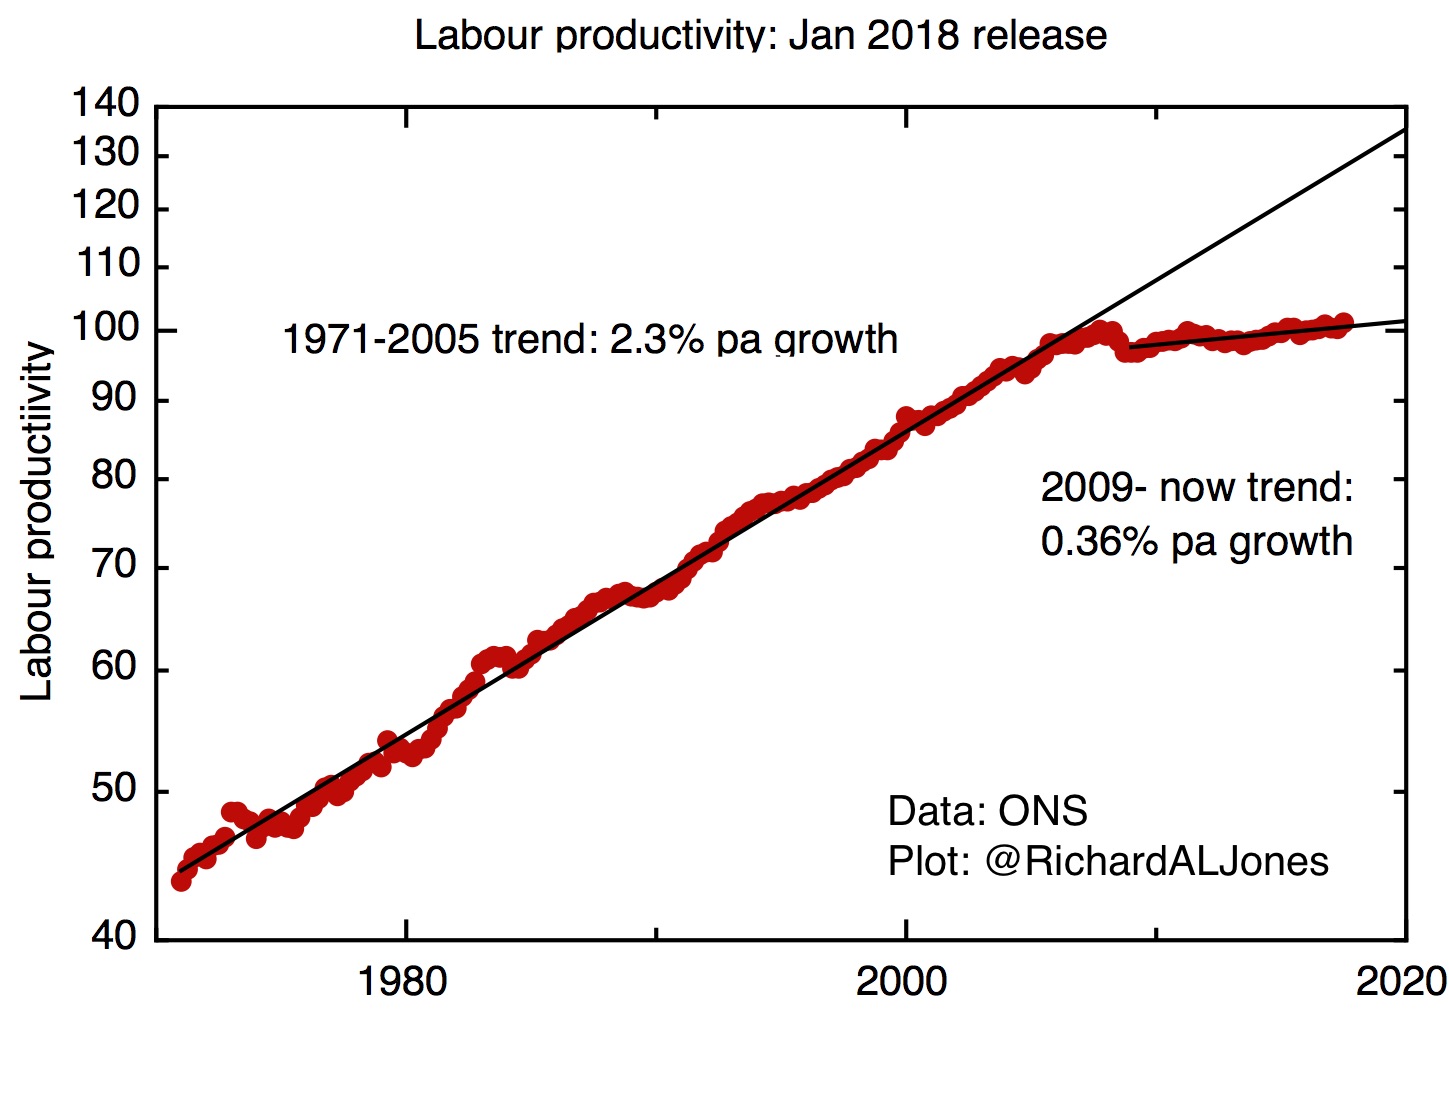
These characteristics are a challenge to our conventional way of thinking about how economies work. Haskel and Westlake convincingly argue that these new characteristics could help explain some puzzling and unsatisfactory characteristics of our economy now – the stagnation we’re seeing in productivity growth, and the growth of inequality.

But how has this situation arisen? To what extent is the growth of the intangible economy inevitable, and how much arises from political and economic choices our society has made?

Let’s return to the comparison between Kodak and Instagram that Jaron Lanier makes – a comparison which I think is fundamentally flawed. The impact of mass digitisation of images is obvious to everyone who has a smartphone. But just because the images are digital, doesn’t mean they don’t need physical substrates, to capture the images, store and display them. Instagram may be a company based entirely on intangible assets, but it couldn’t exist without a massive material base. The smartphones themselves are physical artefacts of enormous sophistication, the product of supply chains of great complexity, with materials and components being made in many factories, that themselves use much expensive, sophisticated and very physical plant. Any while we might think of the “cloud” as some disembodied place where the photographs live, the cloud is, as someone said, just someone else’s computer – or more accurately, someone else’s giant, energy-hogging, server farm.

Much of the intangible economy only has value inasmuch as it is embodied in physical products. This, of course, has always been true. The price of an expensive clock made by an 18th century craftsman embodied the skill and knowledge of the craftsmen who made it, itself built up through their investments in learning the trade, the networks of expertise in which so much tacit knowledge was embedded, the value of the brand that the maker had built up. So what’s changed? We still live in a material world, and these intangible investments, important as they are, are still largely realised in physical objects.

It seems to me that the key difference isn’t so much that an intangible economy has grown in place of a material economy, it’s that we’ve moved to a situation in which the relative contributions of the material and the intangible have become much more separable. Airbnb isn’t an entirely ethereal operation; you might book your night away though a slick app, but it’s still bricks and mortar that you stay in. The difference between Airbnb and a hotel chain lies in the way ownership and management of the accommodation is separated from the booking and rating systems. How much this unbundling is inevitable, and how much is the result of political choices? This is the crucial question we need to answer if we are to design policies that will allow our economies and societies to flourish in this new environment.

These questions are dealt with early on in Haskel and Westlake’s book, but I think they deserve more analysis. One factor that Haskel and Westlake correctly point to is simply the continuing decrease in the cost of material stuff as a result of material innovation. This inevitably increases the relative value of services – delivered by humans – relative to material goods, a trend known as Baumol’s cost disease (a very unfortunate and misleading name, as I’ve discussed elsewhere). I think this has to be right, and it surely is an irreversible continuing trend.

But two other factors seem important too – both discussed by Haskel and Westlake, but without drawing out their full implications. One is the way the ICT industry has evolved, in a way that emphasises commodification of components and open standards. This has almost certainly been beneficial, and without it the platform companies that have depended on this huge material base would not have been able to arise and thrive in the same way. Was it inevitable that things turned out this way? I’m not sure, and it’s not obvious to me that if or when a new wave of ICT innovation arises (Majorana fermion based quantum computing, maybe?), to restart the now stuttering growth of computing power, this would unfold in the same way.

The other is the post-1980s business trend to “unbundling the corporation”. We’ve seen a systematic process by which the large, vertically integrated, corporations of the post-war period have outsourced and contracted out many of their functions. This process has been important in making intangible investments visible – in the days of the corporation, many activities (organisational development, staff training, brand building, R&D) were carried out within the firm, essentially outside the market economy – their contributions to the balance sheet being recognised only in that giant accounting fudge factor/balancing item, “goodwill”. As these functions become outsourced, they produce new, highly visible enterprises that specialise entirely in these intangible investments – management consultants, design houses, brand consultants and the like.

This process became supercharged as a result of the wave of globalisation we have just been through. The idea that one could unbundle the intangible and the material has developed in a context where manufacturing, also, could be outsourced to low-cost countries – particularly China. Companies now can do the market research and design to make a new product, outsource its manufacture, and then market it back in the UK. In this way the parts of the value of the product ascribed to the design and marketing can be separated from the value added by manufacturing. I’d argue that this has been a powerful driver of the intangible economy, as we’ve seen it in the developed world. But it may well be a transient.

On the one hand, the advantages of low-cost labour that drove the wave of manufacturing outsourcing will be eroded, both by a tightening labour market in far Eastern economies as they become more prosperous, and by a relative decline in the importance in the contribution of labour to the cost of manufacturing as automation proceeds. On the other hand, the natural tendency of those doing the manufacturing is to attempt to move to capture more of the value by doing their own design and marketing. In smartphones, for example, this road has already been travelled by Korean manufacturer Samsung, and we see Chinese companies like Xiami rapidly moving in the same direction, potentially eroding the margins of that champion of the intangible economy, Apple.

One key driver that might reverse the separation of the material from the intangible is the realisation that this unbundling comes with a cost. The importance of transaction costs in Coase’s theory of the firm is highlighted in Haskel and Westlake’s book, in a very interesting chapter which considers the best form of organisation for a firm operating in the intangible economy. Some argue that a lowering of transaction costs through the application of IT renders the firm more or less redundant, and we should, and will, move to a world where everyone is an independent entrepreneur, contracting out their skills to the highest bidder. As Haskel and Westlake point out, this hasn’t happened; organisations are still important, even in the intangible economy, and organisations need management, though the types of organisation and styles of managements that work best may have evolved. And, power matters, and big organisations can exert power and influence political systems in ways that little ones can not.

One type of friction that I think is particularly important relates to knowledge. The turn to market liberalism has been accompanied by a reification of intellectual property which I think is problematic. This is because the drive to consider chunks of protectable IP – patents – as tradable assets with an easily discoverable market value doesn’t really account for the synergies that Haskel and Westlake correctly identify as central to intangible assets. A single patent rarely has much value on its own – it gets its value as part of a bigger system of knowledge, some of it in the form of other patents, but much more of it as tacit knowledge held in individuals and networks.

The business of manufacturing itself is often the anchor for those knowledge networks. For an example of this, I’ve written elsewhere about the way in which the UK’s early academic lead in organic electronics didn’t translate into a business at scale, despite a strong IP position. The synergies with the many other aspects of the display industry, with its manufacturers and material suppliers already firmly located in the far east, were too powerful.

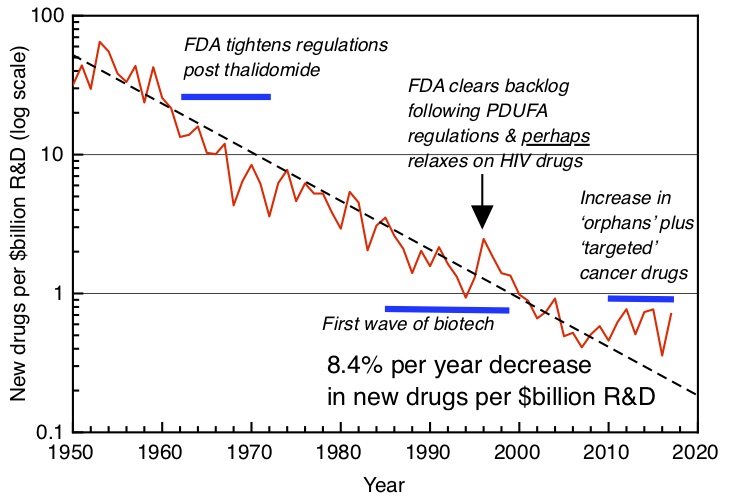
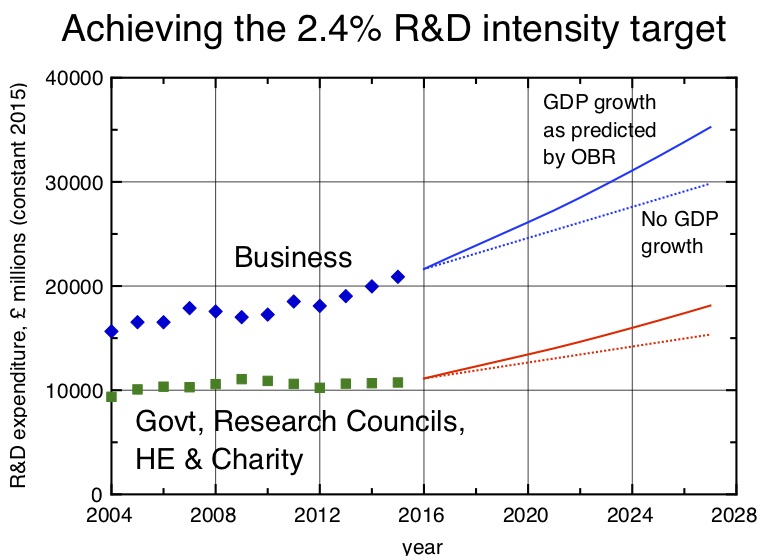
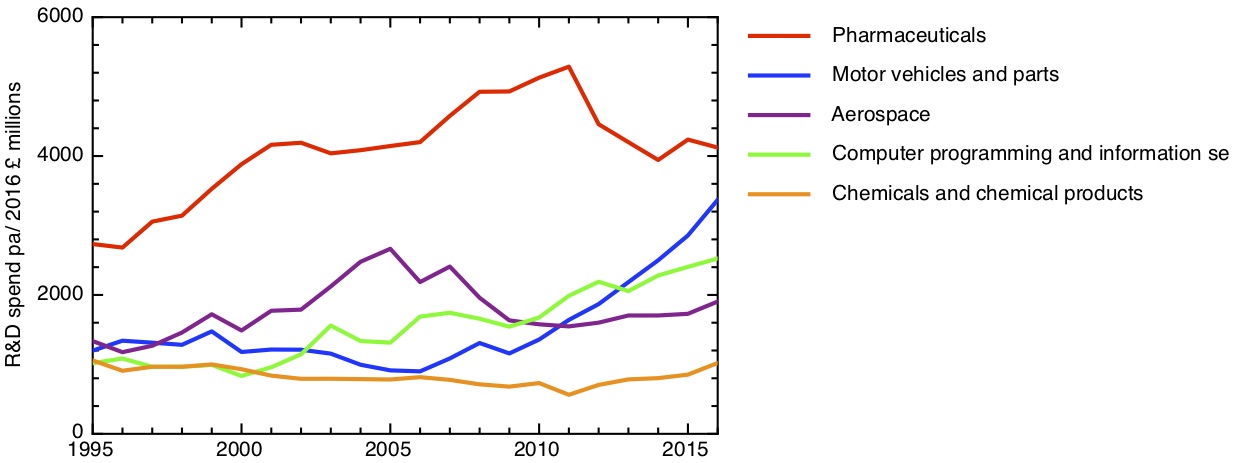
The unbundling strategy has its limits, and so too, perhaps, does the process of separating the intangible from the material. What is clear is that the way our economy currently deals with intangibles has led to wider problems, as Haskel and Westlake’s book makes clear. Intangible investments, for example into the R&D that underlies the new technologies that drive economic growth, do have special characteristics – spillovers and synergies – which lead our economies to underinvest in them, and that underinvestment must surely be a big driver of our current economic and political woes.

“Capitalism without Capital” really is as good as everyone is saying – it’s clear in its analysis, enormously helpful in clarifying assumptions and definitions that are often left unstated, and full of fascinating insights. It’s also rather a radical book, in an understated way. It’s difficult to read it without concluding that our current variety of capitalism isn’t working for us in the conditions we now find ourselves in, with growing inequality, stuttering innovation and stagnating economies. The remedies for this situation that the book proposes are difficult to disagree with; what I’m not sure about is whether they are far-reaching enough to make much difference.

Industrial strategy roundup

Last week saw the launch of the final report of the Industrial Strategy Commission, of which I’m a member. The full report (running to more than 100 pages) can be found here: Industrial Strategy Commission: Final report and executive summary. For a briefer, personal perspective, I wrote a piece for the Guardian website, concentrating on the aspects relating to science and innovation: The UK has the most regionally unbalanced economy in Europe. Time for change.

Our aim in doing this piece of work was to influence government policy, and that’s influenced the pace and timing of our work. The UK’s productivity problems have been in the news, following the Office of Budgetary Responsibility’s recognition that a return to pre-crisis levels of productivity growth is not happening any time soon. Both major political parties are now committed to the principle of industrial strategy; the current government will publish firm proposals in a White Paper, expected within the next few weeks. Naturally, we hope to influence those proposals, and to that end we’ve engaged over the summer with officials in BEIS and the Treasury.

Our formal launch event took place last week, hosted by the Resolution Foundation. The Business Secretary, Greg Clark, spoke at the event, an encouraging sign that our attempts to influence the policy process might have had some success. Even more encouragingly, the Minister said that he’d read the whole report.


The launch of the final report of the Industrial Strategy Commission, at the Resolution Foundation, London. From L to R, Lord David Willetts (Former Science Minister and chair of the Resolution Foundation), Diane Coyle (Member of the Industrial Strategy Commission), Dame Kate Barker (Chair of the Industrial Strategy Commission), Torsten Bell (Director of the Resolution Foundation), Greg Clark (Secretary of State for Business, Energy and Industrial Strategy), Richard Jones (Member of the Industrial Strategy Commission). Photo: Ruth Arnold.

Our aim was to help build a consensus across the political divide about industrial strategy – one strong conclusion we reached is that strategy will only be effective if it is applied consistently over the long term, beyond the normal political cycle. So it was good to see generally positive coverage in the press, from different political perspectives.

The Guardian focused on our recommendations about infrastructure: Tackle UK’s north-south divide with pledge on infrastructure, say experts. The Daily Telegraph, meanwhile, focused on productivity: Short-termism risks paralysing the UK’s industrial strategy, report warns: “Productivity was a major concern of the report, particularly the disparity between London and the rest of the UK…. Targeted investment to support high-value and technologically led industries was the best way to boost regional productivity, by generating clusters of research and development organisations outside of the London and the South-East, the report suggested.”

The Independent headlined its report with our infrastructure recommendation: UK citizens should be entitled to ‘universal basic infrastructure’, says independent commission. It also highlighted some innovation recommendations: “The state should use its purchasing power to create new markets and drive innovation in healthcare and technology to tackle climate change, the commission said”

Even the far-left paper the Morning Star was approving, though they wrongly reported that our commission had been set up by government (in fact, we are entirely independent, supported only by the Universities of Sheffield and Manchester). Naturally, they focused on our diagnoses of the current weaknesses of the UK economy, quoting comments on our work from Greg Clark’s Labour Party shadow, Rebecca Long Bailey: Use Autumn Statement to address long-term weaknesses in our economy, says Rebecca Long Bailey.

In the more specialist press, Research Fortnight concentrated on our recommendations for government structures, particularly the role of UKRI, the new umbrella organisation for research councils and funding agencies: Treasury should own industrial strategy, academics say.

There are a couple of other personal perspectives on the report from members of the commission. My Sheffield colleague Craig Berry focuses on the need for institutional reform in his blogpost Industrial strategy: here come the British, while Manchester’s Andy Westwood focuses on the regional dimensions of education policy (or lack of them, at present) in the Times Higher: Industrial Strategy Commission: it is time to address UK’s major regional inequalities.

Finally, Andy Westwood wrote a telling piece on the process itself, which resonated very strongly with all the Commission members: Why we wonk – a case study.