Steel and the dematerialisation (or not) of the world economy

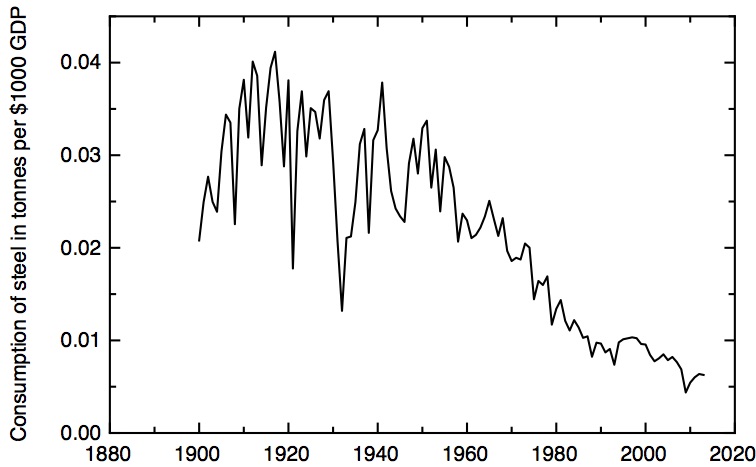
The UK was the country in which mass production of steel began, so the current difficulties of the UK’s steel industry are highly politically charged. For many, it is unthinkable that a country with pretensions to be an economic power could lose its capacity to mass produce steel. To others, though, the steel industry is the epitome of the old heavy industry that has been superseded by the new, weightless economy of services, now supercharged by new digital technologies; we should not mourn its inevitable passing. So, is steel irrelevant, in our new, dematerialised economy? Here are two graphs which, on the face of it, seem to tell contradictory stories about the importance, or otherwise, of steel in modern economies.

USA_steel_per_dollar_GDP
The “steel intensity” of the economy of the USA – the amount of steel required to produce unit real GDP output (expressed as 1000’s of 2009 US dollars).

The first graph shows, for the example of the USA, the steel intensity of the economy, defined as the amount of steel required to produce unit GDP output. Continue reading “Steel and the dematerialisation (or not) of the world economy”

An international perspective on the productivity slowdown

Robert Gordon’s book “The Rise and Fall of American Growth” comprehensively describes the fall in productivity growth in the USA from its mid-twentieth century highs, as I discussed in my last post. Given the book’s exclusive focus on the USA, it’s interesting to set this in a more international context by looking at the data for other developed countries.

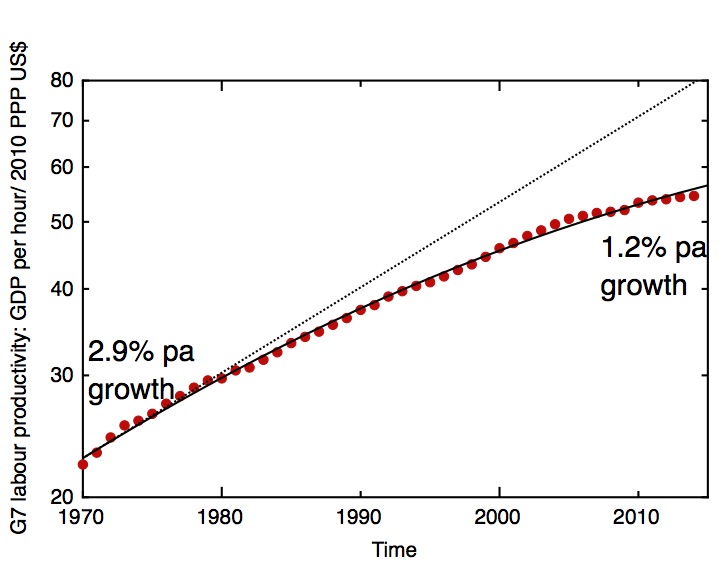
My first graph shows the labour productivity – defined as GDP per hour worked – for the G7 group of developed nations since 1970. This data, from the OECD, has been converted into constant US dollars at purchasing power parity; one should be aware that these currency conversions are not completely straightforward. Nonetheless, the picture is very clear. On this semi-logarithmic plot, a constant annual growth rate will produce a straight line. Instead, what we see is a systematic slow-down in the growth rate as we go from 1970 to the present day. I have fitted the data to a logistic function, which is a good representation of growth that starts out exponential and starts to saturate. In 1970, labour productivity in the G7 nations was growing at around 2.9% annually, but by the present day this had dropped to an annual growth rate of 1.2%.

G7 productivity

Labour productivity across the G7 group of nations – GDP per hour worked, currencies converted at purchasing power parity and expressed as constant 2010 US$. The fit (solid line) is a logistic function, corresponding to an annual growth rate of 2.9% in 1970, dropping to 1.2% in 2014. OECD data.

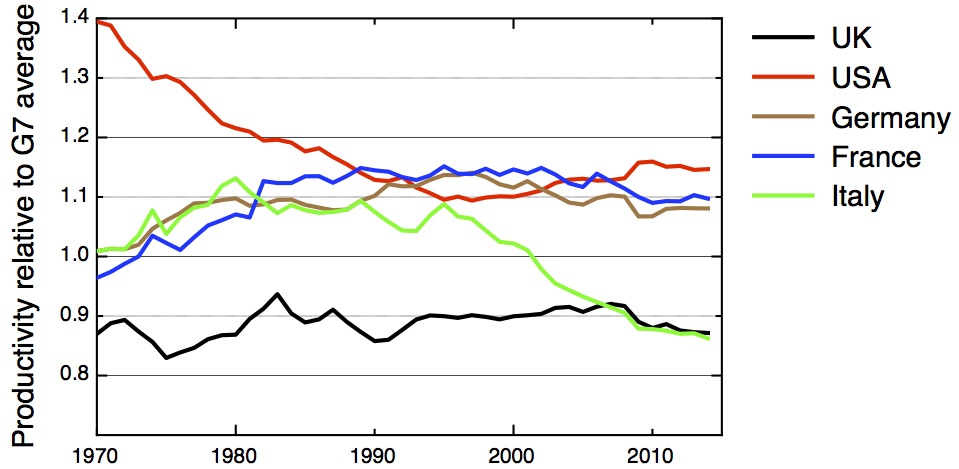
The second graph shows the evolution of labour productivity in a few developed countries as expressed as a fraction of this G7 average.

Productivity vs G7

Labour productivity relative to the G7 average. OECD data

Both at the beginning of the period, in 1970, and at the present day, the USA is the world’s productivity leader, the nation at the technology frontier. But the intervening period saw a long relative decline through the 1970s and ’80s, and a less dramatic recovery. The mirror image of this performance is shown by France and Germany, whose labour productivity performances have marched in step. France and Germany’s relative improvement in productivity performance took them ahead of the USA on this measure in the early 1990’s, but they have slipped back slightly in the last decade.

The UK, however, has been a persistent productivity laggard. Its low point was reached in 1975, when its productivity fell to 17% below the G7 average. After a bumpy performance in the 1980s, there was a slow improvement in the ’90s and ’00s, but much of this ground was lost in the financial crisis of 2008, leaving UK productivity around 13% below the G7 average, and 24% below the world’s productivity leader, the USA.

It is Italy, however, that has had the most dramatic evolution, beginning the period showing the same improvement as France and Germany, but then enduring a long decline, to end up with a productivity performance as poor as the UK’s.

Nobody knows anything (oil price edition)

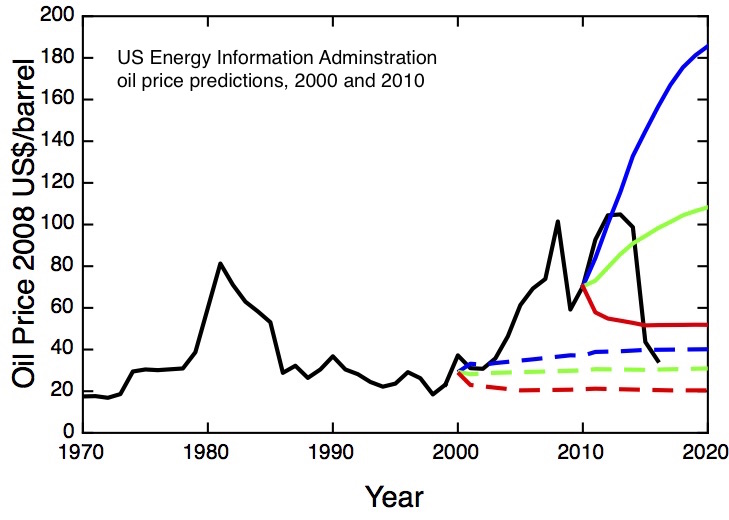
Perhaps no single number is more important to the world economy than the price of oil. Modern economies depend on energy, and oil remains our largest energy source, supplying 31% of the world’s energy needs (another 21% comes from gas, whose price now moves quite closely with oil). And yet, huge movements in this number seemingly take experts by complete surprise.

OIl price predictions 2015
The price of oil in constant 2008 dollars, compared with the US Energy Information Authority predictions from 2000 and 2010. Data from the EIA.

My graph shows how the price of oil, corrected for inflation, has changed in the last 45 years. This is an updated version of the plot I blogged about five years ago; I included the set of predictions that the US Energy Information Administration had made in 2000. Just a few years later, these predictions were made nugatory by a large, unanticipated rise in oil prices. The predictions the EIA made ten years later, in 2010, had learnt one lesson – they included a much bigger spread between the high and low contingencies, amounting to more than a factor of three by the end of the decade. Now, only halfway into the period of the prediction, we see that the way oil prices turned out has so far managed both to exceed the high prediction and to undershoot the low one.

These gyrations mean that views that were conventional wisdom just a couple of years ago have to be rethought. Continue reading “Nobody knows anything (oil price edition)”

England’s early energy transition to fossil fuels: driven by process heat, not steam engines

Was the industrial revolution an energy revolution, in which the energy constraints of a traditional economy based on the power of the sun were broken by the discovery and exploitation of fossil fuel? Or was it an ideological revolution, in which the power of free thinking and free markets unlocked human ingenuity to power a growth in prosperity without limits? Those symbols of the industrial revolution – the steam engine, the coke-fuelled blast furnace – suggest the former, but the trend now amongst some economic historians is to downplay the role of coal and steam. What I think is correct is that the industrial revolution had already gathered much momentum before the steam engine made a significant impact. But coal was central to driving that early momentum; its use was already growing rapidly, but the dominant use of that coal was as a source of heat energy in a whole variety of industrial processes, not as a source of mechanical power. The foundations of the industrial revolution were laid in the diversity and productivity of those industries propelled by coal-fuelled process heat: the steam engine was the last thing that coal did for the industrial revolution, not the first.

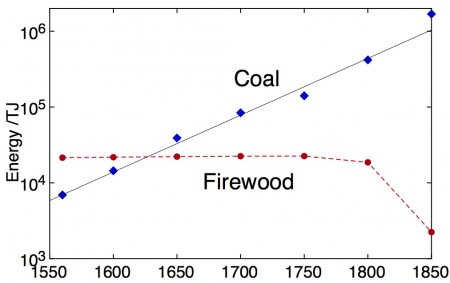
What’s apparent, and perhaps surprising, from a plot of the relative contributions of coal and firewood to England’s energy economy, is how early in history the transition from biomass to fossil fuels took place. Using estimates quoted by Wrigley (a compelling advocate of the energy revolution position), we see that coal use in England grew roughly exponentially (with an annual growth rate of around 1.7%) between 1560 and 1800. The crossover between firewood and coal happened in the early seventeenth century, a date which is by world standards very early – for the world as a whole, Smil estimates this crossover only happened in the late 19th century.

coal_vs_firewood

Estimated consumption of coal and biomass fuels in England and Wales; data from Wrigley – Energy and the English Industrial Revolution.

So why did coal use become so important so early in England? Continue reading “England’s early energy transition to fossil fuels: driven by process heat, not steam engines”

Innovation, research and the UK’s productivity crisis (the shorter version)

I have a much shorter version of my earlier three-part series (PDF version here) on the connection between the UK’s weak and worsening R&D performance and its current productivity standstill on HEFCE’s blog: Innovation, research and the UK’s productivity crisis.

The same piece has also been published on the blog of the Sheffield Political Economy Research Institute: Continuing on our current path of stagnating productivity and stagnating innovation isn’t inevitable: it’s a political choice, and it also appears on the web-based economics magazine Pieria.

The longer and more detailed post also formed the basis for my written evidence to the House of Commons Business Innovation and Skills Select Committee, which is currently inquiring into the productivity problem: On productivity and the government’s productivity plan (PDF).

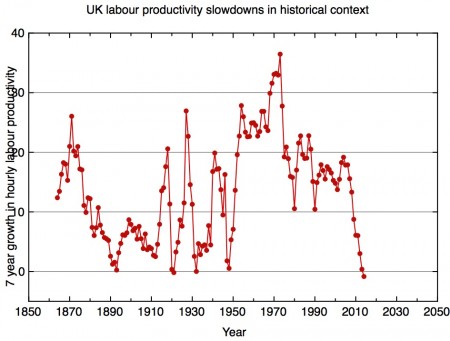
Finally, here’s another graphical representation of the productivity problem in historical context, using the latest version of the Bank of England’s historical dataset “Three centuries of macroeconomic data”. It shows the total growth in hourly labour productivity over the preceding seven years; on this measure the current productivity slow-down is worse than that associated with two world wars and a great depression.

7yearproductivity_blog

Seven year growth in hourly labour productivity. Data from Hills, S, Thomas, R and Dimsdale, N (2015) “Three Centuries of Data – Version 2.2”, Bank of England.

The wrong direction

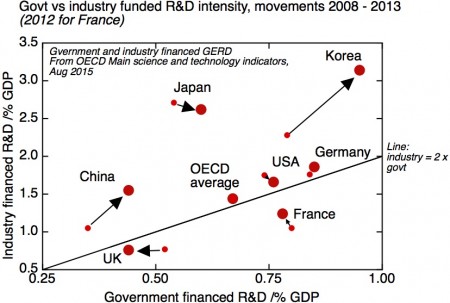
How does the UK compare with other leading research intensive economies, and how has its relative position changed in recent years? The graph above is an attempt to answer both questions graphically, separating out the contributions of both the public sector and the private sector to the overall R&D intensity of the economy as a proportion of GDP, and illustrating the trajectories of this expenditure since 2008. The UK stands out as having begun the period with a weak R&D performance, and since then it has gone in the wrong direction.

Govt vs Industry GERD timev2

Plotting both the private sector and public sector contributions to national R&D efforts stresses that there is a positive correlation between the two – public sector R&D tends to “crowd in” private R&D spending (1). Across the OECD on average, the private sector spends roughly twice as much on R&D as does the public sector, though in East Asian countries the private sector does more. The UK is substantially less R&D intensive than major competitors, and both public and private sectors contribute to this weak performance.

We can see some different trajectories in recent years. China and Korea stand out by their large increases in both private sector and public sector R&D intensity. Continue reading “The wrong direction”

Innovation, research, and the UK’s productivity crisis – part 3

This the third and final in a series of three posts. The first part is here, and this follows on directly from part 2

(Added 2/9/2015: For those who dislike the 3-part blog format, the whole article can be downloaded as a PDF here: Innovation, research and development, and the UK’s productivity crisis).

Quantifying the productivity benefits of research and development

The UK’s productivity problem is an innovation problem. This conclusion follows from the analysis of Goodridge, Haskel and Wallis, at least if one equates the economist’s construction of total factor productivity with innovation. This needs some qualification, because when economists talk about innovation in this context they mean anything that allows one to produce more economic output with the same inputs of labour and capital. So this can result from the development of new high value products or new, better processes to make existing products. Such developments are often, but not always, the result of formal research and development.

But there are many other types of innovation. People continually work out better ways of doing things, either as a result of formal training or simply by learning from experience, they act on suggestions from users, they copy better practises from competitors, they see new technologies in action in other sectors and apply them in their own, they work out more effective ways of organising and distributing their work; all these lead to total factor productivity growth and count as innovation in this sense.

There has been a tendency to underplay the importance of formal research and development in recent thinking about innovation, particularly in the UK. Continue reading “Innovation, research, and the UK’s productivity crisis – part 3”

Innovation, research, and the UK’s productivity crisis – part 2

This the second in a series of three posts, and continues directly from part 1.

Analysing the UK’s productivity slow-down

There are many theories of why the UK’s productivity growth has stalled, and in the absence of proper analysis it’s all too easy to chose a favoured hypothesis on the basis of anecdotes or a single data point, picked out to fit one’s ideological predilections. Indeed, I could be accused of doing just that, by drawing attention the UK’s weak R&D record; others might immediately start looking at a lack of competitiveness in the economy, or insufficient deregulation, as the root of the issue. But it would be surprising if such a striking occurrence had just a single cause, so a more careful analysis should help us not just by ruling possible causes in or out, but by ascribing different weights to multiple causes.

A better analysis needs both to consider what we mean by productivity and its different causes in more detail, and to look at the economy on a finer scale, looking both at the productivity performance of different sectors and the balance in the economy between those different sectors. Continue reading “Innovation, research, and the UK’s productivity crisis – part 2”

Innovation, research and development, and the UK’s productivity crisis – part 1

This is the first of a series of three posts in which I bring together some thinking and reading I’ve been doing about the UK’s current productivity problem, and its relationship to innovation and to research and development.

(Added 2/9/2015: For those who dislike the 3-part blog format, the whole article can be downloaded as a PDF here: Innovation, research and development, and the UK’s productivity crisis)

In part 1, here, I take stock of the scale of the UK’s productivity problem and discuss why it matters so much, both economically and politically. Then I’ll set the context for the following discussion with a provocative association between productivity growth and R&D intensity.

In part 2, I’ll review what can be said with more careful analyses of productivity, looking at the performance of individual sectors and testing some more detailed explanations of the productivity slowdown. I’ll pick out the role of declining North Sea oil and gas and the end of the financial services bubble in the UK’s poor recent performance; these don’t explain all the problem, but they will provide a headwind that the economy will have to overcome over the coming years.

Finally in part 3 I’ll return to a more detailed discussion of innovation in general and the particular role of R&D, finishing with some thoughts about what should be done about the problem.

The scale of the UK’s productivity problem

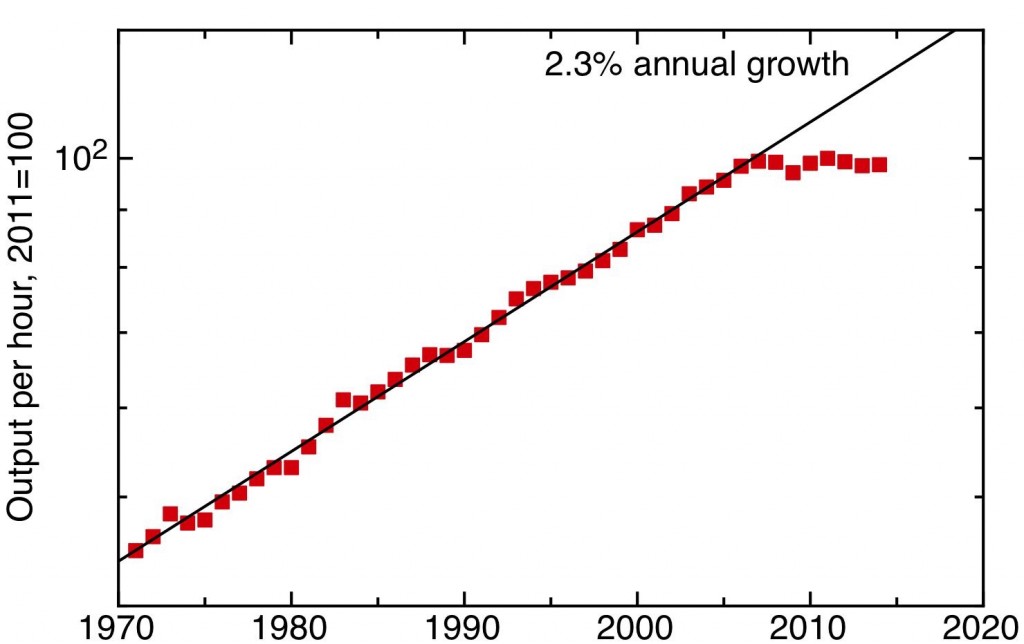
The UK’s current stalling of productivity growth is probably the UK’s most serious current economic problem. In terms of output per hour, the last five years’ productivity performance has been by far the worst period in the last 45 years. Many other developed economies have had disappointing productivity growth in recent years, but the UK’s record is particularly bad. Amongst other developed economics, only Luxembourg and Greece have done worse since 2007, according to a recent OECD report on the future of productivity (see table A2, p83).

labourproductivity
Labour productivity since 1970. The fit is an exponential corresponding to constant growth of 2.3% a year. ONS data.

My plot shows the UK’s labour productivity – defined as the GDP generated per hour worked – since 1971. Continue reading “Innovation, research and development, and the UK’s productivity crisis – part 1”

I chose to graduate

I’m sure there are some people who, very early on in their lives, work out what they want to do and then set out single-mindedly to achieve their aims. For the rest of us, choices are made and paths are set without us really being conscious of those junctions, so we look back and wonder how was it that our lives unfolded in this way and not in another. And yet, looking back, we sometimes can see moments, or short periods, that were decisive in setting us down one path and cutting off other possibilities. For me, the summer of 1982 was the time that determined that I was going to end up being a scientist, and to some extent what sort of scientist I would end up being, though I don’t suppose at any moment at the time I had any idea that this was the case.

Mont Blanc du Tacul

The East Face of Mont Blanc du Tacul, a 4,248 m peak in the French Alps

It began on the bus to Chamonix, in the French Alps, in the summer vacation after my second year at University. Continue reading “I chose to graduate”