Theresa May on Science and Industrial Strategy

It’s not often that a UK Prime Minister devotes a whole speech to science, so Theresa May’s speech on Monday – PM speech on science and modern Industrial Strategy – was a significant signal by itself. It’s obvious that Brexit consumes a huge amount of political and government bandwidth at the moment, so its interesting that the Prime Minister wants to associate herself with the science and industrial strategy agenda, perhaps to emphasise that Brexit is not completely all-consuming, and there is some space left for domestic policy initiatives.

Beyond the signal, though, I thought there was quite a lot of substance as well. The speech comes at an important moment – the UK government’s science and innovation funding agencies have just been through a major reorganisation, with seven discipline-based research councils, the innovation agency Innovate UK, and a body responsible for the research environment in English universities, coming together in a single organisation, UK Research and Innovation. UKRI began life on 1 April, and it launched its first major strategy document on 14th May. This document isn’t a strategy, though – it’s a “Strategic Prospectus” – a statement of some fundamental principles, together with a commitment to develop a strategy over the months to come. The PM’s speech didn’t mention UKRI at all – somewhat curiously, I thought. Nonetheless, the speech is an important statement of the direction UKRI will be expected to take.

Perhaps the most important commitment was the PM’s stress on the 2.4% R&D intensity target, together with a recognition that this needs a substantial increase in private sector funding, catalysed by state investment. I’ve already written about how stretching this target will be. My estimate is that it will need a £7 billion increase in government spending by 2027 – going well beyond the £2.2 billion increase to 2021 already announced – and a £14 billion increase in private sector spending. These are big numbers; to achieve them will require a significant shifting of the UK’s economic landscape (for the better, I believe). My suspicion is that the attempt to achieve them will have a very big influence on the way UKRI operates, perhaps a bigger influence than people yet realise.

Another important departure from science and innovation policy up to now was the insistence that everywhere in the UK should benefit from it – “backing businesses and building infrastructure not just in London and the South East but across every part of our country”. This needs to include those cities that were pioneers of innovation in the 19th century, but which since have suffered the effects of deindustrialisation. This of course speaks to the profound regional imbalances in R&D expenditure that I highlighted in my recent blogpost Making UKRI work for the whole UK.

Can old cities find new economic tricks? The PM’s speech pointed to some examples – from jute to video games in Dundee, fish to offshore wind in Hull, coal to compound semiconductors in Cardiff. Cities and regions do need to specialise. The PM’s speech didn’t mention any specific mechanisms for encouraging and supporting this, but on the same day UKRI announced a new “place-based” funding competition – the “Strength in Places Fund”, which represents a valuable first step. The aim is to develop interventions on a scale to make a material difference to local and regional economies, and it’s great news that the very distinguished economist Dame Kate Barker – who chaired the Industrial Strategy Commission – has been persuaded to chair the assessment panel.

One interesting section of the speech went some way to sharpening up thinking about “Grand Challenges” and “Missions” as organising principles for research. Last November’s Industrial Strategy White Paper introduced four “Grand Challenges” for the UK – on AI and data, the future of mobility, clean growth, and the ageing society. Within these “Grand Challenges”, the intention is to define more specific “missions”. These are more concrete than the Grand Challenges, with some hard targets. Politicians like to announce targets, because they make good headlines – artificial intelligence is “to help prevent 22,000 cancer deaths a year by 2033”, according to the BBC’s (somewhat inaccurate) trail of the speech . I think targets are helpful because they focus policy-makers’ minds on scale. It’s been a besetting sin of UK innovation policy to identify the right things to do, but then to execute them on a scale wholly inadequate to the task.

The PM’s speech announced four such “missions”, and I thought these examples were quite good ones. Two of these missions – around better diagnostics, and support for independent living for older people – are good examples of putting innovation for health and social care at the centre of industrial strategy, as the Industrial Strategy Commission recommended in its final report. Some questions remain.

One simple question that there needs to be an answer for when we talk about “mission-led innovation” is this – who will be the customer for the products that the innovation produces? The government – or the NHS – is the obvious answer for this question in the context of health and social care – but obvious doesn’t mean straightforward. We’ve seen many years of people (including me) saying we should use government procurement much more to drive innovation, to depressingly little effect. What this highlights is that the problems and barriers are as much organisational and cultural as technological. I’m entirely prepared to believe that machine learning techniques could potentially be very helpful in speeding up cancer diagnoses, but realising their benefits will take changes in organisation and working practises.

The other outstanding issue is how these “Grand Challenges” and “missions” are chosen. Is it going to be on the basis of which businessman last caught the ear of a minister, or what a SPAD read in the back of the Economist this week? On the contrary, one would hope – these decisions would be made by aggregating the collective intelligence of a very diverse range of people. This should include scientists, technologists and people from industry, but also the people who see the problems that need to be overcome in their everyday working lives. The UKRI Strategic Prospectus talks warmly about the need for public engagement, including the need to “listen and respond to a diverse range of views and aspirations about what people want research and innovation to do for them”. This needs to be converted into real mechanisms for including these voices in the formulation of these grand challenges and missions.

The Prime Minister may have wanted to give a speech about science to get away from Brexit for a few minutes, but of course there’s no escape, and the consequences of Brexit on our science and innovation system are uncertain and likely to be serious. So it was important and welcome that the PM – particularly this Prime Minister, and former Home Secretary – spelt out the importance of international collaboration, the huge contribution of the many overseas scientists who have chosen to base their careers and lives in the UK, and the value that overseas students bring to our universities. But warm words are not enough, and there needs to be a change in climate and culture in the Home Office on this issue.

One place where we have heard many warm words, but as yet little concrete action, has been in the question of the future relationship between the UK and the EU’s research and innovation programmes. Here it was enormously welcome to hear the Prime Minister state unequivocally that the UK wishes to be fully associated with the successor to Horizon 2020, and is prepared to pay for that. Stating a wish doesn’t make it happen, of course, but it is huge progress to hear that this is now a negotiating goal for the UK government. This is one goal that should be politically unproblematic, and should benefit both sides, so we must hope it can be realised.
The Second Coming of UK Industrial Strategy

I have a longish piece in the Winter issue of the US science policy journal “Issues in Science and Technology”, which aims to place our current debates about industrial strategy in the UK in a longer historical context. This is now online here: The Second Coming of UK Industrial Strategy. Here is the introduction to the article:

The United Kingdom dismantled industrial policies in the 1980s; today it must rebuild them to create a social-industrial complex.

Industrial strategy, as a strand of economic management, was killed forever by the turn to market liberalism in the 1980s. At least, that’s how it seemed in the United Kingdom, where the government of Margaret Thatcher regarded industrial strategy as a central part of the failed post-war consensus that its mission was to overturn. The rhetoric was about uncompetitive industries producing poor-quality products, kept afloat by oceans of taxpayers’ cash. The British automobile industry was the leading exhibit, not at all implausibly, for those of us who remember those dreadful vehicles, perhaps most notoriously exemplified by the Austin Allegro.

Meanwhile, such things as the Anglo-French supersonic passenger aircraft Concorde and the Advanced Gas-cooled Reactor program (the flagship of the state-controlled and -owned civil nuclear industry) were subjected to serious academic critique and deemed technical successes but economic disasters. They exemplified, it was argued, the outcomes of technical overreach in the absence of market discipline. With these grim examples in mind, over the next three decades the British state consciously withdrew from direct sponsorship of technological innovation.

In this new consensus, which coincided with a rapid shift in the shape of the British economy away from manufacturing and toward services, technological innovation was to be left to the market. The role of the state was to support “basic science,” carried out largely in academic contexts. Rather than an industrial strategy, there was a science policy. This focused on the supply side—given a strong academic research base, a supply of trained people, and some support for technology transfer, good science, it was thought, would translate automatically into economic growth and prosperity.

And yet today, the term industrial strategy has once again become speakable. The current Conservative government has published a white paper—a major policy statement—on industrial strategy, and the opposition Labour Party presses it to go further and faster.

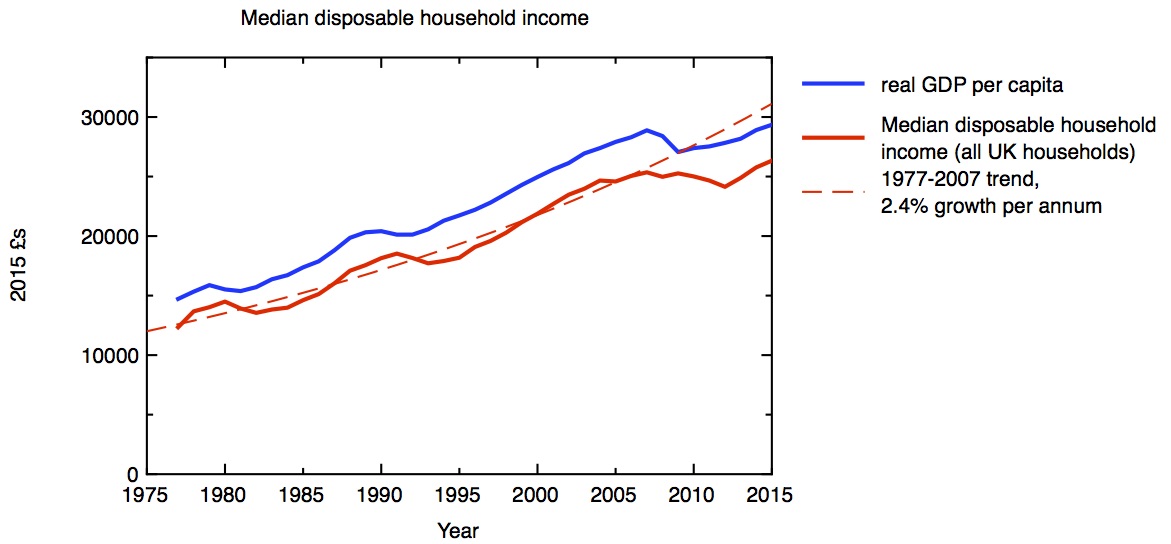
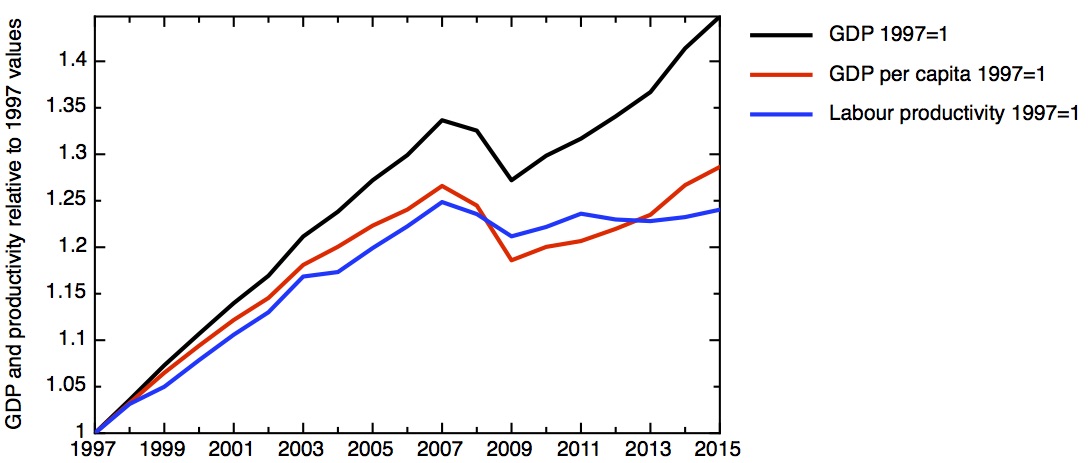
This new mood has been a while developing. It began with the 2007-8 financial crisis. The economic recovery following that crisis has been the slowest in a century; a decade on, with historically low productivity growth, stagnant wage growth, and no change to profound regional economic inequalities, coupled with souring politics and the dislocation of the United Kingdom’s withdrawal from the European Union, many people now sense that the UK economic model is broken.

Given this picture, several questions are worth asking. How did we get here? How have views about industrial strategy and science and innovation policy changed, and to what effect? Going forward, what might a modern UK industrial strategy look like? And what might other industrialized nations experiencing similar political and economic challenges learn from these experiences?

Read the rest of the article here.

Making UK Research and Innovation work for the whole UK

The first of April saw the formal launch of UK Research and Innovation, the new body which will be responsible for the bulk of public science and innovation funding in the UK. All seven research councils, the innovation funding agency InnovateUK, and the research arm of the body formerly responsible for university funding in England, to be renamed Research England, have been folded into this single body, with a budget of more than £6 billion a year.

Expectations for this new body are very high. Its formation has been linked to the government’s decision to increase research funding substantially, with extra funding rising to £2.3 billion by 2021/2. This new money is explicitly linked to the need to increase the productivity of the UK economy. The government has also committed to a 10-year target of raising the overall R&D intensity of the economy from its current 1.7% to 2.4% of GDP. As I’ve discussed earlier, this is a very challenging target that will require a major change in behaviour from the UK”s private sector, as well as substantial increases in public sector R&D. UKRI has the task of ensuring that the extra public sector investment is made in ways that maximise increases in private sector R&D. All of this, of course, takes place with the background of Brexit, and the need for the UK to rebuild its business model.

There’s one factor that, unless urgently addressed, will hold UKRI back from its mission of making a significant difference to the UK’s overall productivity problems and raising the economy’s R&D intensity. That is the extraordinary and unhealthy concentration of publicly funded R&D in a relatively small part of the country – London, the Southeast, and East Anglia. Entirely uncoincidentally, these are the parts of the country with the most productive economies already. As the Industrial Strategy Commission (of which I was a member) stressed in its final report last year, unless the UK fixes its gross regional economic disparities it will never be able to prosper.

No-one has done more to bring attention to the UK’s unbalanced R&D geography than Tom Forth; everyone should read his recent article on how we should use the increase in funding to redress the balance. One key point that Tom has stressed is the geographical relationship – or lack of it – between public and private sector research. Industry spends roughly twice as much as the government on research, so reaching the 2.4% R&D intensity target will not be possible without major increases in private sector spending – roughly £14 billion a year, by my estimate. Yet classical economics tells us that firms will always underinvest in R&D, because they are unable to capture the full economic benefit of their spending, much of which “spills over” to benefit the rest of the economy. That’s the logic which convinces even HM Treasury that the state ought to support R&D.

Yet Tom Forth’s work – especially his plots of of public against private R&D spending – shows how badly government spending on R&D is matched to the demand of industry, as measured by where industry actually invests its own money.

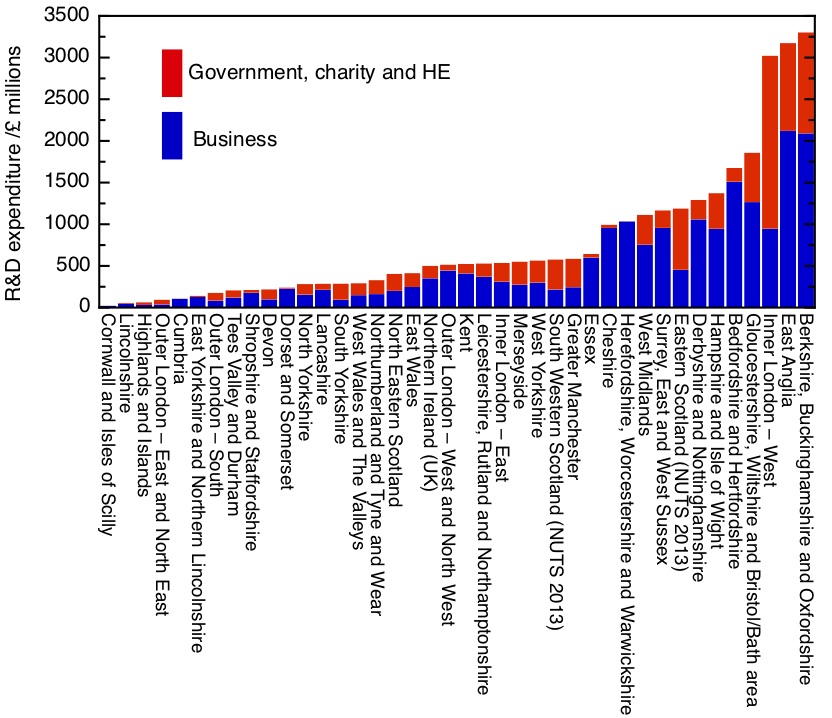
R&D funding in the business and non-business sectors (government, higher education and charity), by NUTS2 regions. 2014 figures, by sector of performance, from Eurostat.

My first graph shows how unbalanced the UK’s research landscape is. This shows R&D spending – both private and public – broken down sub-regionally. The first thing that’s obvious is the dominance of three sub-regions – Oxford and its environs, Cambridge and its sub-region, and (part of) London – inner West London. These three subregions – out of a total of 40 in the UK – account for 31% of total UK R&D spending, and an even higher fraction of spending in the government, HE and charity sectors – 41%.

There is a striking difference between these three sub-regions, though, and that is their split between public and private R&D (taking public R&D here to mean R&D carried out in government-owned laboratories, universities and the non-profit sector). Overall in the UK, the value of business R&D stands at 1.89 times the value of public R&D. East Anglia – dominated by Cambridge – does even better than this, with private sector R&D coming in at more than twice public sector R&D. This is a science-based cluster that works, with high levels of public R&D being rewarded at above average rates by private sector R&D.

The Oxford, Berks and Bucks sub-region does slightly less well in converting its very large public investment into private R&D, with a multiplier a little below the national average at 1.72.

The real anomaly, though, is Inner London (West). This single region receives by far the largest amount of public R&D spending of any single region – nearly 20% of the entire public funding for R&D. Yet the rate of return on this, in terms of private sector R&D, is only 0.46, far below the national average.

Working down the list, we find 9 sub-regions with respectable levels of total R&D. These include Bristol, Hampshire, Derby, Bedford, Surrey and the West Midlands, Worcestershire and Cheshire. With the exception of East Scotland, all these sub-regions are characterised by above average ratios of private to public sector R&D. Two sub-regions stand out for significant private sector R&D and almost no public sector activity – Cheshire, with its historic concentration of chemical and pharmaceutical industries, and Warwickshire, Herefordshire and Worcestershire.

Then we come to the long tail, with much lower investment in R&D, either public or private. All of Wales, Northern Ireland, the North of Engand, Southwest England beyond Bristol, outer east and southeast London and Kent, Lincolnshire – this is pretty much a map of left-behind Britain.

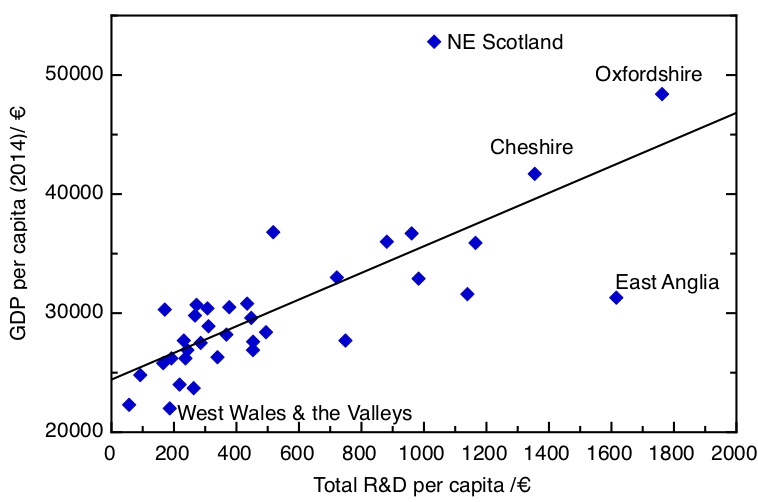
This brings us to the question: why should we worry about regional disparities in R&D? Let’s put aside for the moment any question of fairness – what it comes back to is productivity. If we plot R&D intensity against regional GDP, we find quite a respectable correlation. (Slightly to my surprise, the correlation is strongest if you plot total R&D – both public and private, rather than just business R&D. I’ve ommitted London entirely as it is such an outlier on both measures).

Sub-regional GDP per capita against total R&D (public and private) per capita. 2014 data, from Eurostat.

Of course, the relationship is not a straightforward one: higher R&D intensities are associated with the presence of high-productivity firms at the technology frontier, there may be a more general effect of higher skill levels associated with regions with higher R&D, and there may well be other factors, direct and indirect, at play too. We can also see outliers. NE Scotland has very high productivity but mid-level R&D investment, not doubt because of the importance of the oil industry, while East Anglia has relatively low productivity given the very high levels of R&D. I suspect the latter is associated with the relatively concentrated nature of the Cambridge cluster, whose effect doesn’t really penetrate far into a large and relatively poor rural and coastal hinterland.

As the Industrial Strategy Commission argued, just as a matter of arithmetic averages, we cannot expect the productivity of the country as a whole to grow if such a large fraction is structurally lagging. So what should we do? Different places demand different approaches, and Tom Forth has some suggestions.

On London, I agree with Tom – the over-investment of public R&D in London is a grotesque misallocation of public resources, but the realities of political economy mean it’s likely to stay that way. At the least, we certainly need to stop building new institutions there. One thing the data does highlight, though, is how concentrated even within London the investment is, so initiatives like UCL East, aiming to spread the benefits of the investment to less favoured parts of the capital, are to be welcomed.

The eight sub-regions with high private sector R&D and public underinvestment offer a clear rationale for further public investment. One needs to be aware of the arbitrary nature of these sub-regional boundaries – the strength of the Cheshire cluster is a very good reason to have a strong Chemistry department in the University of Liverpool, for example – but these regions are likely to provide some very strong investment cases for following the private sector money to support existing clusters.

I somewhat disagree with Tom on the case of Oxford and Cambridge (and here of course my biases may be showing). Tom believes that funding should be frozen in these places until they agree to allow more growth. As far as Cambridge is concerned, I’m not sure this is quite right – there seems to be a huge amount of growth happening in that city at the moment, with significant numbers of new-build apartments going up in the city, and a string of new suburbs like Eddington being built around its fringes, complete with new schools and supermarkets. The issue here is the completely inadequate transport infrastructure to get into and around the city; it’s these infrastructure problems that are stopping the further growth of what is the UK’s most successful science-based cluster, and are stopping the spread of its benefits to its less prosperous hinterland.

But this leaves the bigger problem – how can public R&D investments be used to raise productivity and economic growth in what is the majority of the country, where levels of R&D investment, both public and private, are far too small? It’s easy to imagine arbitrary and ill-thought through investments imposed on regions with no understanding of the potential their economic history and current industrial base will support. But for a counter-example, in my own city, Sheffield, I think there has been a well thought through policy based on promoting advanced manufacturing through investments in translational research and skills, which is bearing fruit through the twin routes of the attraction of inward investment from firms at the technological frontier and improving the performance of the existing business base.

Where does this leave the new organisation, UK Research and Innovation, whose job should be to rectify these issues? It’s not going to be easy, given that the cultures of the organisations UKRI are being built from have been positively opposed to place-based policy. The research councils have focused on “research excellence” as the sole criterion for funding, while the policy of InnovateUK has been to be led by industry. But “place-blind” policies inevitably lead to research concentration, though the well-known Matthew effect. I know that EPSRC at least has been seriously grappling with these issues in the last couple of years, while there is real expertise in Research England on the economic potential of universities in their cities and regions, so there is something to build on.

The early actions of the new organisation are not encouraging. The move back from Swindon to London is a retrograde step, suggesting that UKRI’s first priority is keeping ministers happy and keeping ahead of Whitehall office politics. When the Technology Strategy Board (the predecessor organisation to InnovateUK) was first set up as a free-standing funding agency, it was moved out of London to Swindon to emphasise that it served business, not Whitehall, and it was the better for it.

Moreover, the main board of UKRI is conspicuous for its lack of geographical diversity – out of 16 members, just one – Aberdeen’s Ian Diamond – is from outside London and the southeast. Allowing this situation to arise was a telling and worrying oversight.

One urgent concrete step UKRI should take is to create a high-level advisory board to hold its feet to the fire on a plan to rebalance R&D expenditure across the country. UKRI is to produce a strategy within the next month or two, and it is to be hoped that addressing the regional balance issue forms a central part of this strategy. This board should include senior representatives from the Devolved Administrations, and economic development leads from the metro mayors’ offices and combined authorities in the regions of England. At an operational level, UKRI needs to get its staff out of their London home, perhaps with regional specialists seconded to economic development units in the regions and nations.

The stakes here are high. UKRI has been set up with great expectations – the substantial injection of extra research spending, the 2.4% R&D target are signals that the government expects UKRI to deliver. If it does not produce tangible, positive effects on the wider economy – across the whole of the UK – UKRI will rightfully be judged to have failed – it will have failed the country, and it will have failed UK science. Let’s hope it can rise to the challenge.

Technological innovation in the linear age

We’re living in an age where technology is accelerating exponentially, but people’s habits of thought are stuck in an age where progress was only linear. This is the conventional wisdom of the futurists and the Davos-going classes – but it’s wrong. It may have been useful to say this 30 years ago: then we were just starting on an astonishing quarter century of year-on-year, exponential increases in computing power. In fact, the conventional wisdom is doubly wrong – now that that exponential growth in computing power has come to an end, those people who lived through that atypical period are perhaps the least well equipped to deal with what comes next. The exponential age of computing power that the combination of Moore’s law and Dennard scaling gave us, came to an end in the mid-2000’s, but technological progress will continue. But the character of that progress is different – dare I say it, it’s going to be less exponential, more linear. Now, if you need more computer power, you aren’t going to be able to wait for a year or two for Moore’s law to do its work; you’re much more likely to add another core to your CPU, another server to your datacenter. This transition is going to have big implications for business and our economy, which I don’t see being taken very seriously yet.

Just how much faster have computers got? According to the standard textbook on computer architecture, a high-end microprocessor today has nearly 50,000 times the performance of a 1978 mini-computer, at perhaps 0.25% of the cost. But the rate of increase in computing power hasn’t been uniform. A remarkable plot in this book – Computer Architecture: A Quantitative Approach (6th edn) by John Hennessy & David Patterson – makes this clear.

In the early stages of the microprocessor revolution, between 1978 and 1986, computing power was increasing at a very healthy 25% a year – a doubling time of 3 years. It was around 1986 that the rate of change really took off – between 1986 and 2003 computer power increased at an astonishing 52% a year, a doubling time of just a year and a half.

This pace of advance was checked in 2004. The rapid advance had come about from the combination of two mutually reinforcing factors. The well-known Moore’s law dictated the pace at which the transistors in microprocessors were miniaturised. More transistors per chip gives you more computing power. But there was a less well-known factor reinforcing this – Dennard scaling – which says that smaller transistors allow your computer to run faster. It was this second factor, Dennard scaling, which broke down around 2004, as I discussed in a post last year.

With Moore’s law in operation, but Dennard scaling at an end, between 2003 and 2011, computer power counted to grow, but at the slower rate of 23% – back to a 3 year doubling time. But after 2011, according to Hennessy and Patterson, the growth rate slowed further – down to 3.5% a year since 2015. In principle, this corresponds to a doubling time of 20 years – but, as we’ll see, we’re unlikely to see this happen.

This is a generational change in the environment for technological innovation, and as I discussed in my previous post, I’m surprised that it’s economic implications aren’t being discussed more. There have been signs of this stagnation in everyday life – I think people are much more likely to think twice about replacing their four year old lap-top, say, than they were a decade ago, as the benefits of these upgrades get less obvious. But the stagnation has also been disguised by the growth of cloud computing.

The impressive feats of pattern recognition that allow applications like Alexa and Siri to recognise and respond to voice commands provide a good example of the way personal computing devices give the user the impression of great computer power, when in fact the intensive computation that these applications rely on take place, not in the user’s device, but “in the cloud”. What “in the cloud’ means, of course, is that the computation is carried out by the warehouse scale computers that make up the cloud providers’ server farms.

The end of the era of exponential growth in computing power does not, of course, mean the end of innovation in computing. Rather than relying on single, general purpose CPUs to carry out many different tasks, we’ll see many more integrated circuits built with bespoke architectures optimised for specific purposes. The very powerful graphics processing units that were driven by the need to drive higher quality video displays, but which have proved well-suited to the highly parallel computing needs of machine learning are one example. And without automatic speed gains from progress in hardware, there’ll need to be much more attention given to software optimisation.

What will the economic implications be of moving into this new era? The economics of producing microprocessors will change. The cost of CPUs at the moment is dominated by the amortisation of the huge capital cost of the plant needed to make them. Older plants, whose capital costs are already written off, will find their lives being prolonged, so the cost of CPUs a generation or two behind the leading edge will plummet. This collapse in price of CPUs will be a big driver for the “internet of things”. And it will lead to the final end of Moore’s law, as the cost of new generations becomes prohibitive, squeezed between the collapse in price of less advanced processors and the diminishing returns in performance for new generations.

In considering the applications of computers, habits learnt in earlier times will need to be rethought. In the golden age of technological acceleration, between 1986 and 2003, if one had a business plan that looked plausible in principle but that relied on more computer speed than was currently available, one could argue that another few cycles of Moore’s law would soon sort out that difficulty. At the rates of technological progress in computing prevailing then, you’d only need to wait five years or so for the available computing power to increase by a factor of ten.

That’s not going to be the case now. A technology that is limited by the availability of local computing power – as opposed to computer power in the cloud – will only be able to surmount that hurdle by adding more processors, or by waiting for essentially linear growth in computer power. One example of an emerging technology that might fall into this category would be truly autonomous self-driving vehicles, though I don’t know myself whether this is the case.

The more general macro-economic implications are even less certain. One might be tempted to associate the marked slowing in productivity growth that the developed world saw in the mid-2000’s with the breakdown in Dennard scaling and the end of the fastest period of growth in computer power, but I’m not confident that this stacks up, given the widespread rollout of existing technology, coupled with much greater connectivity through broadband and mobile that was happening at that time. That roll-out, of course, has still got further to go.

This paper – by Neil Thompson – does attempt to quantify the productivity hit to ICT using firms caused by the end of Dennard scaling in 2004, finding a permanent hit to total factor productivity of between 0.5 and 0.7 percentage points for those firms that were unable to adapt their software to the new multicore architectures introduced at the time.

What of the future? It seems inconceivable that the end of the biggest driving force in technological progress over the last forty years would not have some significant macroeconomic impact, but I have seen little or no discussion of this from economists (if any readers know different, I would be very interested to hear about it). This seems to be a significant oversight.

Of course, it is the nature of all periods of exponential growth in particular technologies to come to an end, when they run up against physical or economic limits. What guarantees continued economic growth is the appearance of entirely new technologies. Steam power grew in efficiency exponentially through much of the 19th century, and when that growth levelled out (due to the physical limits of Carnot’s law) new technologies – the internal combustion engine and electric motors – came into play to drive growth further. So what new technologies might take over from silicon CMOS based integrated circuits to drive growth from here?

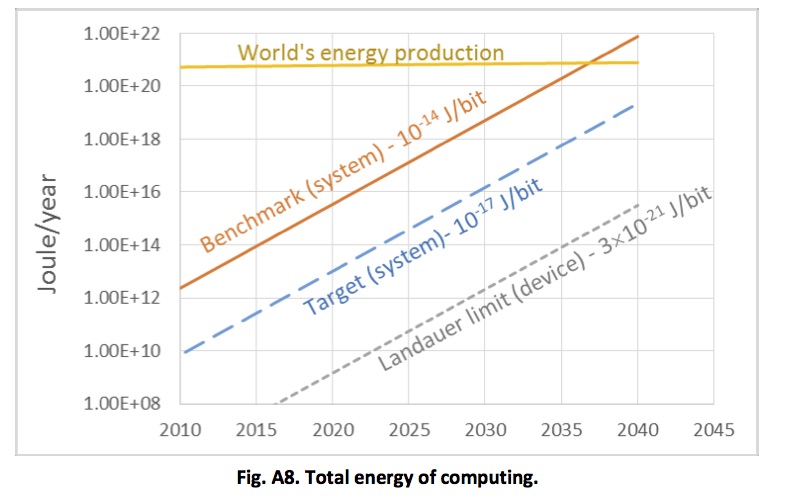
To restrict the discussion to computing, there are at least two ways of trying to look to the future. We can look at those areas where the laws of physics permit further progress, and the economic demand to drive that progress is present. One obvious deficiency of our current computing technology is its energy efficiency – or lack of it. There is a fundamental physical limit on the energy consumption of computing – the Landauer limit – and we’re currently orders of magnitude away from that. So there’s plenty of room at the bottom here, as it were – and as I discussed in my earlier post, if we are to increase the available computing power of the world simply by building more data centres using today’s technology before long this will be using a significant fraction of the world’s energy needs. So much lower power computing is both physically possible and economically (and environmentally) needed.

We can also look at those technologies that currently exist only in the laboratory, but which look like they have a fighting chance of moving into commercial scales sometime soon. Here the obvious candidate is quantum computing; there really does seem to be a groundswell of informed opinion that quantum computing’s time has come. In physics labs around the world there’s a real wave of excitement at that point where condensed matter physics met nanotechnology, in the superconducting properties of nanowires, for example. Experimentalists are chasing the predicted existence of a whole zoo of quasi-particles (that is quantised collective excitations) with interesting properties, with topics such as topological insulators and Majorana fermion states now enormously fashionable. The fact that companies such as Google and Microsoft have been hoovering up the world’s leading research groups in this area give further cause to suspect that something might be going on.

The consensus about quantum computing among experts that I’ve spoken to is that this isn’t going to lead soon to new platforms for general purpose computing (not least because the leading candidate technologies still need liquid helium temperatures), but that it may give users a competitive edge in specialised uses such as large database searches and cryptography. We shall see (though one might want to hesitate before making big long-term bets which rely on current methods of cryptography remaining unbreakable – some cryptocurrencies, for example).

Finally, one should not forget that information and computing isn’t the only place where innovation takes place – a huge amount of economic growth was driven be technological change before computers were invented, and perhaps new non-information based innovation might drive another future wave of economic growth.

For now, what we can say is that the age of exponential growth of computer power is over. It gave us an extraordinary 40 years, but in our world all exponentials come to an end, and we’re now firmly in the final stage of the s-curve. So, until the next thing comes along, welcome to the linear age of innovation.

An intangible economy in a material world

Thirty years ago, Kodak dominated the business of making photographs. It made cameras, sold film, and employed 140,000 people. Now Instagram handles many more images than Kodak ever did, but when it was sold to Facebook in 2012, it employed 13 people. This striking comparison was made by Jaron Lanier in his book “You are not a gadget”, to stress the transition we have made to world in which value is increasingly created, not from plant and factories and manufacturing equipment, but from software, from brands, from business processes – in short, from intangibles. The rise of the intangible economy is the theme of a new book by Jonathan Haskel and Stian Westlake, “Capitalism without Capital”. This is a marvellously clear exposition of what makes investment in intangibles different from investment in the physical capital of plant and factories.

These differences are summed up in a snappily alliterative four S’s. Intangible assets are scalable: having developed a slick business process for selling over-priced coffee, Starbucks could very rapidly expand all over the world. The costs of developing intangible assets are sunk – having spent a lot of money building a brand, if the business doesn’t work out it’s much more difficult to recover much of those costs than it would be to sell a fleet of vans. And intangibles have spillovers – despite best efforts to protect intellectual property and keep the results secret, the new knowledge developed in a company’s research programme inevitably leaks out, benefitting other companies and society at large in ways that the originating firm can’t benefit from. And intangibles demonstrate synergies – the value of many ideas together is usually greater – often very much greater – than the sum of the parts.

These characteristics are a challenge to our conventional way of thinking about how economies work. Haskel and Westlake convincingly argue that these new characteristics could help explain some puzzling and unsatisfactory characteristics of our economy now – the stagnation we’re seeing in productivity growth, and the growth of inequality.

But how has this situation arisen? To what extent is the growth of the intangible economy inevitable, and how much arises from political and economic choices our society has made?

Let’s return to the comparison between Kodak and Instagram that Jaron Lanier makes – a comparison which I think is fundamentally flawed. The impact of mass digitisation of images is obvious to everyone who has a smartphone. But just because the images are digital, doesn’t mean they don’t need physical substrates, to capture the images, store and display them. Instagram may be a company based entirely on intangible assets, but it couldn’t exist without a massive material base. The smartphones themselves are physical artefacts of enormous sophistication, the product of supply chains of great complexity, with materials and components being made in many factories, that themselves use much expensive, sophisticated and very physical plant. Any while we might think of the “cloud” as some disembodied place where the photographs live, the cloud is, as someone said, just someone else’s computer – or more accurately, someone else’s giant, energy-hogging, server farm.

Much of the intangible economy only has value inasmuch as it is embodied in physical products. This, of course, has always been true. The price of an expensive clock made by an 18th century craftsman embodied the skill and knowledge of the craftsmen who made it, itself built up through their investments in learning the trade, the networks of expertise in which so much tacit knowledge was embedded, the value of the brand that the maker had built up. So what’s changed? We still live in a material world, and these intangible investments, important as they are, are still largely realised in physical objects.

It seems to me that the key difference isn’t so much that an intangible economy has grown in place of a material economy, it’s that we’ve moved to a situation in which the relative contributions of the material and the intangible have become much more separable. Airbnb isn’t an entirely ethereal operation; you might book your night away though a slick app, but it’s still bricks and mortar that you stay in. The difference between Airbnb and a hotel chain lies in the way ownership and management of the accommodation is separated from the booking and rating systems. How much this unbundling is inevitable, and how much is the result of political choices? This is the crucial question we need to answer if we are to design policies that will allow our economies and societies to flourish in this new environment.

These questions are dealt with early on in Haskel and Westlake’s book, but I think they deserve more analysis. One factor that Haskel and Westlake correctly point to is simply the continuing decrease in the cost of material stuff as a result of material innovation. This inevitably increases the relative value of services – delivered by humans – relative to material goods, a trend known as Baumol’s cost disease (a very unfortunate and misleading name, as I’ve discussed elsewhere). I think this has to be right, and it surely is an irreversible continuing trend.

But two other factors seem important too – both discussed by Haskel and Westlake, but without drawing out their full implications. One is the way the ICT industry has evolved, in a way that emphasises commodification of components and open standards. This has almost certainly been beneficial, and without it the platform companies that have depended on this huge material base would not have been able to arise and thrive in the same way. Was it inevitable that things turned out this way? I’m not sure, and it’s not obvious to me that if or when a new wave of ICT innovation arises (Majorana fermion based quantum computing, maybe?), to restart the now stuttering growth of computing power, this would unfold in the same way.

The other is the post-1980s business trend to “unbundling the corporation”. We’ve seen a systematic process by which the large, vertically integrated, corporations of the post-war period have outsourced and contracted out many of their functions. This process has been important in making intangible investments visible – in the days of the corporation, many activities (organisational development, staff training, brand building, R&D) were carried out within the firm, essentially outside the market economy – their contributions to the balance sheet being recognised only in that giant accounting fudge factor/balancing item, “goodwill”. As these functions become outsourced, they produce new, highly visible enterprises that specialise entirely in these intangible investments – management consultants, design houses, brand consultants and the like.

This process became supercharged as a result of the wave of globalisation we have just been through. The idea that one could unbundle the intangible and the material has developed in a context where manufacturing, also, could be outsourced to low-cost countries – particularly China. Companies now can do the market research and design to make a new product, outsource its manufacture, and then market it back in the UK. In this way the parts of the value of the product ascribed to the design and marketing can be separated from the value added by manufacturing. I’d argue that this has been a powerful driver of the intangible economy, as we’ve seen it in the developed world. But it may well be a transient.

On the one hand, the advantages of low-cost labour that drove the wave of manufacturing outsourcing will be eroded, both by a tightening labour market in far Eastern economies as they become more prosperous, and by a relative decline in the importance in the contribution of labour to the cost of manufacturing as automation proceeds. On the other hand, the natural tendency of those doing the manufacturing is to attempt to move to capture more of the value by doing their own design and marketing. In smartphones, for example, this road has already been travelled by Korean manufacturer Samsung, and we see Chinese companies like Xiami rapidly moving in the same direction, potentially eroding the margins of that champion of the intangible economy, Apple.

One key driver that might reverse the separation of the material from the intangible is the realisation that this unbundling comes with a cost. The importance of transaction costs in Coase’s theory of the firm is highlighted in Haskel and Westlake’s book, in a very interesting chapter which considers the best form of organisation for a firm operating in the intangible economy. Some argue that a lowering of transaction costs through the application of IT renders the firm more or less redundant, and we should, and will, move to a world where everyone is an independent entrepreneur, contracting out their skills to the highest bidder. As Haskel and Westlake point out, this hasn’t happened; organisations are still important, even in the intangible economy, and organisations need management, though the types of organisation and styles of managements that work best may have evolved. And, power matters, and big organisations can exert power and influence political systems in ways that little ones can not.

One type of friction that I think is particularly important relates to knowledge. The turn to market liberalism has been accompanied by a reification of intellectual property which I think is problematic. This is because the drive to consider chunks of protectable IP – patents – as tradable assets with an easily discoverable market value doesn’t really account for the synergies that Haskel and Westlake correctly identify as central to intangible assets. A single patent rarely has much value on its own – it gets its value as part of a bigger system of knowledge, some of it in the form of other patents, but much more of it as tacit knowledge held in individuals and networks.

The business of manufacturing itself is often the anchor for those knowledge networks. For an example of this, I’ve written elsewhere about the way in which the UK’s early academic lead in organic electronics didn’t translate into a business at scale, despite a strong IP position. The synergies with the many other aspects of the display industry, with its manufacturers and material suppliers already firmly located in the far east, were too powerful.

The unbundling strategy has its limits, and so too, perhaps, does the process of separating the intangible from the material. What is clear is that the way our economy currently deals with intangibles has led to wider problems, as Haskel and Westlake’s book makes clear. Intangible investments, for example into the R&D that underlies the new technologies that drive economic growth, do have special characteristics – spillovers and synergies – which lead our economies to underinvest in them, and that underinvestment must surely be a big driver of our current economic and political woes.

“Capitalism without Capital” really is as good as everyone is saying – it’s clear in its analysis, enormously helpful in clarifying assumptions and definitions that are often left unstated, and full of fascinating insights. It’s also rather a radical book, in an understated way. It’s difficult to read it without concluding that our current variety of capitalism isn’t working for us in the conditions we now find ourselves in, with growing inequality, stuttering innovation and stagnating economies. The remedies for this situation that the book proposes are difficult to disagree with; what I’m not sure about is whether they are far-reaching enough to make much difference.

Should economists have seen the productivity crisis coming?

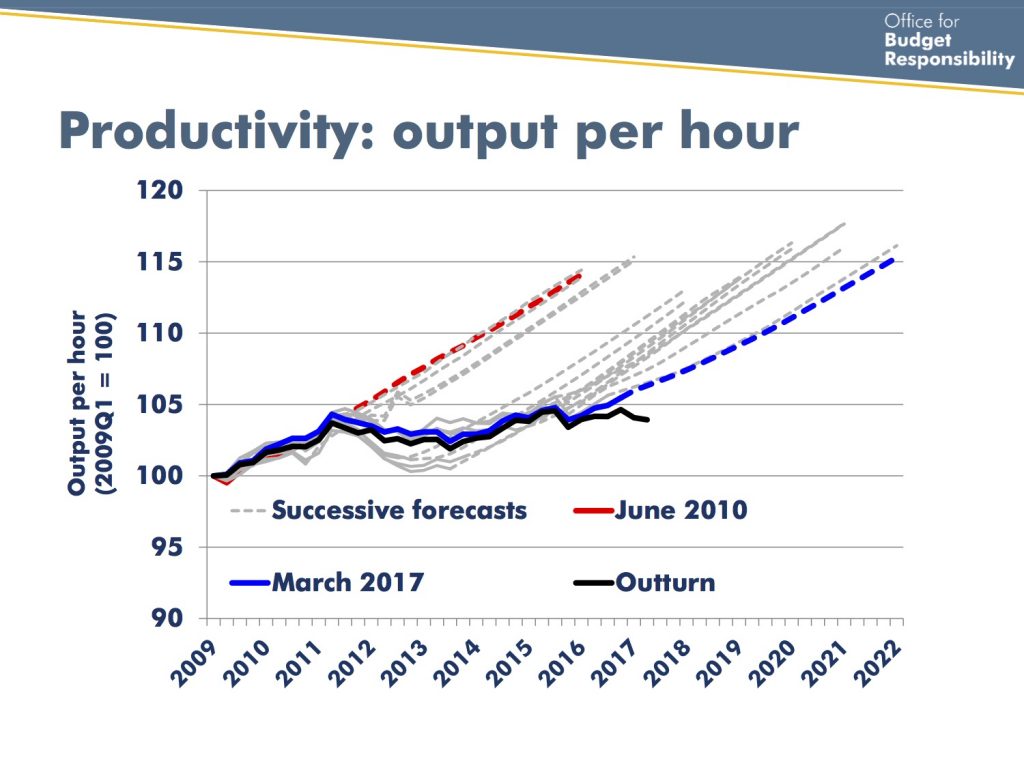
The UK’s post-financial crisis stagnation in productivity finally hit the headlines this month. Before the financial crisis, productivity grew at a steady 2.2% a year, but since 2009 growth has averaged only 0.3%. The Office of Budgetary Responsibility, in common with other economic forecasters, have confidently predicted the return of 2.2% growth every year since 2010, and every year they have been disappointed. This year, the OBR has finally faced up to reality – in its 2017 Forecast Evaluation Report, it highlights the failure of productivity growth to recover. The political consequences are severe – lower forecast growth means that there is less scope to relax austerity in public spending, and there is little hope that the current unprecedented stagnation in wage growth will recover.

Are the economists to blame for not seeing this coming? Aditya Chakrabortty thinks so, writing in a recent Guardian article: “A few days ago, the officials paid by the British public to make sure the chancellor’s maths add up admitted they had got their sums badly wrong…. The OBR assumed that post-crash Britain would return to normal and that normal meant Britain’s bubble economy in the mid-2000s. This belief has been rife across our economic establishment.”

The Oxford economist Simon Wren-Lewis has come to the defense of his profession. Explaining the OBR’s position, he writes “Until the GFC, macro forecasters in the UK had not had to think about technical progress and how it became embodied in improvements in labour productivity, because the trend seemed remarkably stable. So when UK productivity growth appeared to come to a halt after the GFC, forecasters were largely in the dark.”

I think this is enormously unconvincing. Economists are unanimous about the importance of productivity growth as the key driver of the economy, and agree that technological progress (sufficiently widely defined) is the key source of that productivity growth. Why, then, should macro forecasters not feel the need to think about technical progress? As a general point, I think that (many) economists should pay much more attention both to the institutions in which innovation takes place (for example, see my critique of Robert Gordon’s book) and to the particular features of the defining technologies of the moment (for example, the post-2004 slowdown in the rate of growth of computer power).

The specific argument here is that the steadiness of the productivity growth trend before the crisis justified the assumption that this trend would be resumed. But this assumption only holds if there was no reason to think anything fundamental in the economy had changed. It should have been clear, though, that the UK economy had indeed changed in the years running up to 2007, and that these changes were in a direction that should have at least raised questions about the sustainability of the pre-crisis productivity trend.

These changes in the economy – summed up as a move to greater financialisation – were what caused the crisis in the first place. But, together with broader ideological shifts connected with the turn to market liberalism, they also undermined the capacity of the economy to innovate.

Our current productivity stagnation undoubtedly has more than one cause. Simon Wren-Lewis, in his discussion of the problem, has focused on the effect of bad macroeconomic policy. It seems entirely plausible that bad policy has made the short-term hit to growth worse than it needed to be. But a decade on from the crisis, we’re not looking at a short-term hit anymore – stagnation is the new normal. My 2016 paper “Innovation, research and the UK’s productivity crisis” discusses in detail the deeper causes of the problem.

One important aspect is the declining research and development intensity of the UK economy. The R&D intensity of the UK economy fell from more than 2% in the early 80’s to a low point of 1.55% in 2004. This was at a time when other countries – particularly the fast-developing countries of the far-east – were significantly increasing their R&D intensities. The decline was particularly striking in business R&D and the applied research carried out in government laboratories; for details of the decline see my own 2013 paper “The UK’s innovation deficit and how to repair it”.

What should have made this change particularly obvious is that it was, at least in part, the result of conscious policy. The historian of science Jon Agar wrote about Margaret Thatcher’s science policy in a recent article
“The curious history of curiosity driven research”. Thatcher and her advisors believed that the government should not be in the business of funding near-market research, and that if the state stepped back from these activities, private industry would step up and fill the gap: “The critical point was that Guise [Thatcher’s science policy advisor] and Thatcher regarded state intervention as deeply undesirable, and this included public funding for near-market research. The ideological desire to remove the state’s role from funding much applied research was the obverse of the new enthusiasm for ‘curiosity-driven research’.”

But stepping back from applied research by the state coincided with a new emphasis on “shareholder value” in public companies, which led industry to cut back on long-term investments with uncertain returns, such as R&D.

Much of this outcome was predictable in economic theory, which predicts that private sector actors will underinvest in R&D due to their inability to capture all of its benefits. Economists’ understanding of innovation and technological change is not yet good enough to quantify the effects of these developments. But, given that, as a result of policy changes, the UK had dismantled a good part of its infrastructure for innovation, a permanent decrease in its potential for productivity growth should not have been entirely unexpected.

The Office of Budgetary Responsibility’s Chart of Despond. From the press conference slides for the October 2017 Forecast Evaluation Report.

The Life Sciences should not have an Industrial Strategy

The UK government has published the first outcome of the Industrial Strategy “sector deals” announced in the spring’s Industrial Strategy Green Paper. The Life Sciences Industrial Strategy was headed by Sir John Bell; the area is of undoubted importance for the UK, and the document has some very sensible recommendations. But there’s a bigger problem here – the life sciences aren’t an industry, they’re a science area. You wouldn’t describe your policies for the aerospace industry as a Materials Science Industrial Strategy or a Fluid Dynamics Industrial Strategy – industry policy should be driven by and framed in terms of the demand for innovation, not by the science areas which contribute to it.

In its detailed policies, there is much to agree with in the Life Sciences Industrial Strategy. There’s no question that the UK has a strong base in the life sciences, that this is a source of comparative advantage, and that this capacity should be preserved and strengthened. New industrial clusters in medical technology should be developed (especially outside the existing concentration of biomedical life sciences between London, Oxford and Cambridge), and the data the health system generates is an enormously powerful resource that should be exploited more (but with great care and sensitivity). And who could disagree with the proposition that the Home Office should be suppressed (they’re too diplomatic to put it quite like that, of course). There are some less good ideas too, with demands for more distorting tax breaks. The proposal to widen the scope of the “patent box” to include other types of intellectual property is a particularly bad idea, which would take what’s already a very poor piece of public policy and make it worse.

The headline recommendation is politically opportunistic, potentially positive, but not completely thought through in its current form. This is for a “Health Advanced Research Program”, in analogy to the US defense research agency DARPA. It’s politically astute in that it appeals to the current bout of DARPA envy amongst British policy makers (and it’s got a good acronym). As I’ve discussed before, I’m not convinced that this enthusiasm is underpinned by enough understanding of the way DARPA actually operates and the way it sits as one relatively small part in the wider USA innovation system.

One key issue is the question of how to define the problems, and being clear about who owns those problems. Part of DARPA’s success comes from the close connection to the people who own the problems the agency is trying to solve, who in DARPA’s case, are in the USA’s military. This clarity is not yet present in the “HARP” proposal. For healthcare, the key owners of the problems are the NHS, and the local authorities responsible for social care. Industry is important, both as potential providers of solutions, and as beneficiaries of the new business opportunities that the innovations should give rise to, but they don’t own the problems.

The strategy does indeed suggest that the key USP of HARP should be the involvement of the NHS, who, it is envisaged, will provide patient data and opportunities for piloting the resulting technology. The difficulty this leaves unsolved is one that the strategy itself correctly identifies – “Evidence demonstrates that access to and diffusion of products in the NHS is often slower than in some comparable countries. This environment risks creating a negative impression in boardrooms around the world with trials being diverted to geographies deemed more likely to use products. Partnership with industry through this strategy and a subsequent sector deal will be challenging unless there are clear signals that innovation will be encouraged and rewarded, and the challenge of adoption of new innovation at pace and scale is resolved.” The NHS is, as currently configured, structurally inimical to innovation.

How could you frame an industrial strategy in this general area? You could define it in terms of conventional industry sectors. For healthcare, this would include those sectors which develop and supply products – including pharmaceuticals and biotechnology, and the broader area of medical technology, including tools and devices, diagnostics and digital healthcare. Equally, it should include those sectors that actually deliver health and social care, which after all form a large part of the economy, albeit one that remains in large part outside the market. These include social care – a very large sector, which has low productivity and is problematic in some other ways, as well as hospitals and primary care. The interests of these sectors don’t always point in the same direction, as one can see from the constant tussles between NICE and the NHS and pharmaceuticals companies about drug pricing and availability.

Although in reality the Life Sciences strategy does largely read as a sector strategy for the pharmaceuticals and biotechnology sector, calling it a Life Sciences strategy does frame it in terms of the underpinning science. And in this sense Life Sciences is not a great term, being at once too inclusive and not inclusive enough.

What the strategy means by “Life Sciences” is essentially the high status science of biomedical research. But life sciences – biology – doesn’t just include those bits of biology that are relevant to human disease. That would cover the cell biology and physiology of the human organism itself, together with the biology of those organisms that are studied as more experimentally tractable models for humans – whether that’s mice or zebra-fish. And it includes the biology of human parasites and pathogens. What is left out in this narrow definition of “Life Sciences” are those aspects of biology that have other applications – in agriculture, for plant science and animal health, in industrial biotechnology, in environmental science and ecology. And of course we should not be afraid to stress that we should study biology because it is fascinating in its own right and yields insights into some of the biggest outstanding scientific issues that there are – how life started, whether other types of life are possible.

But the focus in “Life Sciences” on high status biomedical research is also too exclusive. Other areas of science and technology are important for healthcare, and are underemphasised in academia. These include engineering and nano-science, data science and IT, and, perhaps above all, the social science of public health and health economics.

The issue, then, is that by calling itself a “Life Sciences” strategy, it gives primacy neither to the relevant industry sectors, nor to the fundamental problem of caring for sick people. I think the ultimate goal here is the big problem of providing affordable health and social care with dignity for the whole UK population, in the context of the changing age profile of the country. The key organisations here are the NHS and the deliverers of social care, and the priority needs to be on enabling those organisations to become more innovative. This will certainly generate opportunities for key industrial sectors like pharmaceuticals and medical technology; improving the connections between the research base, industry, and the clinic remains just as important. But framing the problem right will change some of our priorities.

Economics after Moore’s Law

One of the dominating features of the economy over the last fifty years has been Moore’s law, which has led to exponential growth in computing power and exponential drops in its costs. This period is now coming to an end. This doesn’t mean that technological progress in computing will stop dead, nor that innovation in ICT comes to an end, but it is a pivotal change, and I’m surprised that we’re not seeing more discussion of its economic implications.

This reflects, perhaps, the degree to which some economists seem to be both ill-informed and incurious about the material and technical basis of technological innovation (for a very prominent example, see my review of Robert Gordon’s recent widely read book, The Rise and Fall of American Growth). On the other hand, boosters of the idea of accelerating change are happy to accept it as axiomatic that these technological advances will always continue at the same, or faster rates. Of course, the future is deeply uncertain, and I am not going to attempt to make many predictions. But here’s my attempt to identify some of the issues

How we got here

The era of Moore’s law began with the invention in 1959 of the integrated circuit. Transistors are the basic unit of electronic unit, and in an integrated circuit many transistors could be incorporated on a single component to make a functional device. As the technology for making integrated circuits rapidly improved, Gordon Moore, in 1965 predicted that the number of transistors on a single silicon chip would double every year (the doubling time was later revised to 18 months, but in this form the “law” has well described the products of the semiconductor industry ever since).

The full potential of integrated circuits was realised when, in effect, a complete computer was built on a single chip of silicon – a microprocessor. The first microprocessor was made in 1970, to serve as the flight control computer for the F14 Tomcat. Shortly afterwards a civilian microprocessor was released by Intel – the 4004. This was followed in 1974 by the Intel 8080 and its competitors, which were the devices that launched the personal computer revolution.

The Intel 8080 had transistors with a minimum feature size of 6 µm. Moore’s law was driven by a steady reduction in this feature size – by 2000, Intel’s Pentium 4’s transistors were more than 30 times smaller. This drove the huge increase in computer power between the two chips in two ways. Obviously, more transistors gives you more logic gates, and more is better. Less obviously, another regularity known as Dennard scaling states that as transistor dimensions are shrunk, each transistor operates faster and uses less power. The combination of Moore’s law and Dennard scaling was what led to the golden age of microprocessors, from the mid-1990’s, where every two years a new generation of technology would be introduced, each one giving computers that were cheaper and faster than the last.

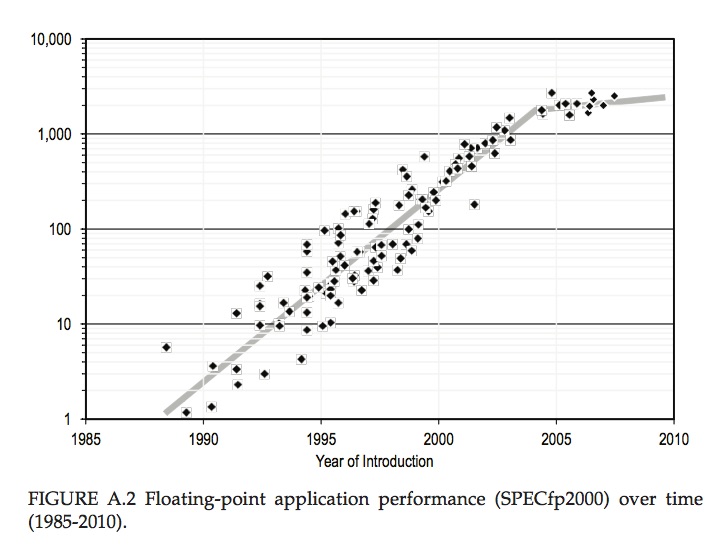
This golden age began to break down around 2004. Transistors were still shrinking, but the first physical limit was encountered. Further increases in speed became impossible to sustain, because the processors simply ran too hot. To get round this, a new strategy was introduced – the introduction of multiple cores. The transistors weren’t getting much faster, but more computer power came from having more of them – at the cost of some software complexity. This marked a break in the curve of improvement of computer power with time, as shown in the figure below.


Computer performance trends as measured by the SPECfp2000 standard for floating point performance, normalised to a typical 1985 value. This shows an exponential growth in computer power from 1985 to 2004 at a compound annual rate exceeding 50%, and slower growth between 2004 and 2010. From “The Future of Computing Performance: Game Over or Next Level?”, National Academies Press 2011″

In this period, transistor dimensions were still shrinking, even if they weren’t becoming faster, and the cost per transistor was still going down. But as dimensions shrunk to tens of nanometers, chip designers ran out of space, and further increases in density were only possible by moving into the third dimension. The “FinFET” design, introduced in 2011 essentially stood the transistors on their side. At this point the reduction in cost per transistor began to level off, and since then the development cycle has begun to slow, with Intel announcing a move from a two year cycle to one of three years.

The cost of sustaining Moore’s law can be measured in diminishing returns from R&D efforts (estimated by Bloom et al as a roughly 8-fold increase in research effort, measured as R&D expenditure deflated by researcher salaries, from 1995 to 2015), and above all by rocketing capital costs.

Oligopoly concentration

The cost of the most advanced semiconductor factories (fabs) now exceeds $10 billion, with individual tools approaching $100 million. This rocketing cost of entry means that now only four companies in the world have the capacity to make semiconductor chips at the technological leading edge.

These firms are Intel (USA), Samsung (Korea), TSMC (Taiwan) and Global Foundries (USA/Singapore based, but owned by the Abu Dhabi sovereign wealth fund). Other important names in semiconductors are now “fabless” – they design chips, that are then manufactured in fabs operated by one of these four. These fabless firms include nVidia – famous for the graphical processing units that have been so important for computer games, but which are now becoming important for the high performance computing needed for AI and machine learning, and ARM (until recently UK based and owned, but recently bought by Japan’s SoftBank), designer of low power CPUs for mobile devices.

It’s not clear to me how the landscape evolves from here. Will there be further consolidation? Or in an an environment of increasing economic nationalism, will ambitious nations regard advanced semiconductor manufacture as a necessary sovereign capability, to be acquired even in the teeth of pure economic logic? Of course, I’m thinking mostly of China in this context – its government has a clearly stated policy of attaining technological leadership in advanced semiconductor manufacturing.

Cheap as chips

The flip-side of diminishing returns and slowing development cycles at the technological leading edge is that it will make sense to keep those fabs making less advanced devices in production for longer. And since so much of the cost of an IC is essentially the amortised cost of capital, once that is written off the marginal cost of making more chips in an old fab is small. So we can expect the cost of trailing edge microprocessors to fall precipitously. This provides the economic driving force for the idea of the “internet of things”. Essentially, it will be possible to provide a degree of product differentiation by introducing logic circuits into all sorts of artefacts – putting a microprocessor in every toaster, in other words.

Although there are applications where cheap embedded computing power can be very valuable, I’m not sure this is a universally good idea. There is a danger that we will accept relatively marginal benefits (the ability to switch our home lights on with our smart-phones, for example) at the price of some costs that may not be immediately obvious. There will be a general loss of transparency and robustness of everyday technologies, and the potential for some insidious potential harms, through vulnerability to hostile cyberattacks, for example. Caution is required!

Travelling without a roadmap

Another important feature of the golden age of Moore’s law and Dennard scaling was a social innovation – the International Technology Roadmap for Semiconductors. This was an important (and I think unique) device for coordinating and setting the pace for innovation across a widely dispersed industry, comprising equipment suppliers, semiconductor manufacturers, and systems integrators. The relentless cycle of improvement demanded R&D in all sorts of areas – the materials science of the semiconductors, insulators and metals and their interfaces, the chemistry of resists, the optics underlying the lithography process – and this R&D needed to be started not in time for the next upgrade, but many years in advance of when it was anticipated it would be needed. Meanwhile businesses could plan products that wouldn’t be viable with the computer power available at that time, but which could be expected in the future.

Moore’s law was a self-fulfilling prophecy, and the ITRS was the document that both predicted the future, and made sure that that future happened. I write this in the past tense, because there will be no more roadmaps. Changing industry conditions – especially the concentration of leading edge manufacturing – has brought this phase to an end, and the last International Technology Roadmap for Semiconductors was issued in 2015.

What does all this mean for the broader economy?

The impact of fifty years of exponential technological progress in computing seems obvious, yet quantifying its contribution to the economy is more difficult. In developed countries, the information and communication technology sector has itself been a major part of the economy which has demonstrated very fast productivity growth. In fact, the rapidity of technological change has itself made the measurement of economic growth more difficult, with problems arising in accounting for the huge increases in quality at a given price for personal computers, and the introduction of entirely new devices such as smartphones.

But the effects of these technological advances on the rest of the economy must surely be even larger than the direct contribution of the ICT sector. Indeed, even countries without a significant ICT industry of their own must also have benefitted from these advances. The classical theory of economic growth due to Solow can’t deal with this, as it isn’t able to handle a situation in which different areas of technology are advancing at very different rates (a situation which has been universal since at least the industrial revolution).

One attempt to deal with this was made by Oulton, who used a two-sector model to take into account the the effect of improved ICT technology in other sectors, by increasing the cost-effectiveness of ICT related capital investment in those sectors. This does allow one to make some account for the broader impact of improvements in ICT, but I still don’t think it handles the changes in relative value over time that different rates of technological improvement imply. Nonetheless, it allows one to argue for substantial contributions to economic growth from these developments.

Have we got the power?

I want to conclude with two questions for the future. I’ve already discussed the power consumption – and dissipation – of microprocessors in the context of the mid-2000’s end of Dennard scaling. Any user of a modern laptop is conscious of how much heat they generate. Aggregating the power demands of all the computing devices in the world produces a total that is a significant fraction of total energy use, and which is growing fast.

The plot below shows an estimate for the total world power consumption of ICT. This is highly approximate (and as far as the current situation goes, it looks, if anything, somewhat conservative). But it does make clear that the current trajectory is unsustainable in the context of the need to cut carbon emissions dramatically over the coming decades.


Estimated total world energy consumption for information and communication technology. From Rebooting the IT Revolution: a call to action – Semiconductor Industry Association, 2015

These rising power demands aren’t driven by more lap-tops – its the rising demands of the data centres that power the “cloud”. As smart phones became ubiquitous, we’ve seen the computing and data storage that they need move from the devices themselves, limited as they are by power consumption, to the cloud. A service like Apple’s Siri relies on technologies of natural language processing and machine learning that are much too computer intensive for the processor in the phone, and instead are run on the vast banks of microprocessors in one of Apple’s data centres.

The energy consumption of these data centres is huge and growing. By 2030, a single data centre is expected to be using 2000 MkWh per year, of which 500 MkWh is needed for cooling alone. This amounts to a power consumption of around 0.2 GW, a substantial fraction of the output of a large power station. Computer power is starting to look a little like aluminium, something that is exported from regions where electricity is cheap (and hopefully low carbon in origin). However there are limits to this concentration of computer power – the physical limit on the speed of information transfer imposed by the speed of light is significant, and the volume of information is limited by available bandwidth (especially for wireless access).

The other question is what we need that computing power for. Much of the driving force for increased computing power in recent years has been from gaming – the power needed to simulate and render realistic virtual worlds that has driven the development of powerful graphics processing units. Now it is the demands of artificial intelligence and machine learning that are straining current capacity. Truly autonomous systems, like self-driving cars, will need stupendous amounts of computer power, and presumably for true autonomy much of this computing will need to be done locally rather than in the cloud. I don’t know how big this challenge is.

Where do we go from here?

In the near term, Moore’s law is good for another few cycles of shrinkage, moving more into the third dimension by stacking increasing numbers of layers vertically, shrinking dimensions further by using extreme UV for lithography. How far can this take us? The technical problems of EUV are substantial, and have already absorbed major R&D investments. The current approaches for multiplying transistors will reach their end-point, whether killed by technical or economic problems, perhaps within the next decade.

Other physical substrates for computing are possible and are the subject of R&D at the moment, but none yet has a clear pathway for implementation. Quantum computing excites physicists, but we’re still some way from a manufacturable and useful device for general purpose computing.

There is one cause for optimism, though, which relates to energy consumption. There is a physical lower limit on how much energy it takes to carry out a computation – the Landauer limit. The plot above shows that our current technology for computing consumes energy at a rate which is many orders of magnitude greater than this theoretical limit (and for that matter, it is much more energy intensive than biological computing). There is huge room for improvement – the only question is whether we can deploy R&D resources to pursue this goal on the scale that’s gone into computing as we know it today.

See also Has Moore’s Law been repealed? An economist’s perspective, by Keith Flamm, in Computing in Science and Engineering, 2017

Towards a coherent industrial strategy for the UK

What should a modern industrial strategy for the UK look like? This week the Industrial Strategy Commission, of which I’m a member, published its interim report – Laying the Foundations – which sets out some positive principles which we suggest could form the basis for an Industrial Strategy. This follows the government’s own Green Paper, Building our Industrial Strategy, to which we made a formal response here. I made some personal comments of my own here. The government is expected to publish its formal policy on Industrial Strategy, in a White Paper, in the autumn.

There’s a summary of our report on the website, and my colleague and co-author Diane Coyle has blogged about it here. Here’s my own perspective on the most important points.

Weaknesses of the UK’s economy

The starting point must be a recognition of the multiple and persistent weaknesses of the UK economy, which go back to the financial crisis and beyond. We still hear politicians and commentators asserting that the economy is fundamentally strong, in defiance both of the statistical evidence and the obvious political consequences we’ve seen unfolding over the last year or two. Now we need to face reality.

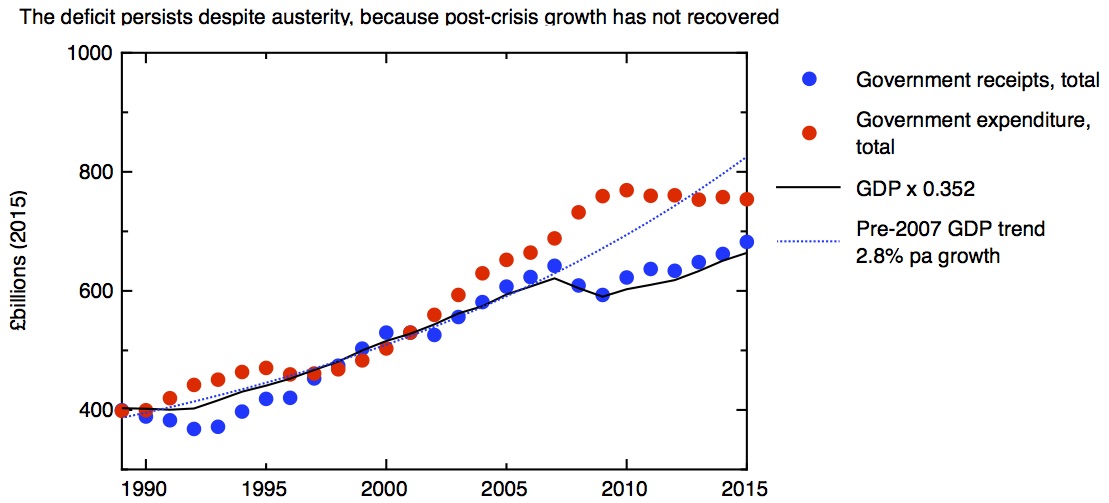
The UK’s economy has three key weaknesses. Its productivity performance is poor; there’s a big gap between the UK and competitor economies, and since the financial crisis productivity growth has been stagnant. This poor productivity performance translates directly into stagnant wage growth and a persistent government fiscal deficit.

There are very large disparities in economic performance across the country; the core cities outside London, rather than being drivers of economic growth, are (with the exception of Bristol and Aberdeen) below the UK average in GVA per head. De-industrialised regions and rural and coastal peripheries are doing even worse. The UK can’t achieve its potential if large parts of it are held back from fully contributing to economic growth.

The international trading position of the country is weak, with large and persistent deficits in the current account. BREXIT threatens big changes to our trading relationships, so this is not a good place to be starting from.

Inadequacy of previous policy responses

The obvious corollary of the UK’s economic weakness has to be a realisation that whatever we’ve been doing up to now, it hasn’t been working. This isn’t to say that the UK hasn’t had policies for industry and economic growth – it has, and some of them have been good ones. But a collection of policies doesn’t amount to a strategy, and the results tell us that even the good policies haven’t been executed at a scale that makes a material difference to the problems we’ve faced.

A strategy should begin with a widely shared vision

A strategy needs to start with a vision of where the country is going, around which a sense of national purpose can be build. How is the country going to make a living, how is it going to meet the challenges it’s facing? This needs to be clearly articulated and a consensus built that will last longer than one political cycle. It needs to be founded on a realistic understanding of the UK’s place in the world, and of the wider technological changes that are unfolding globally.

Big problems that need to be solved

We suggest six big problems that an industrial strategy should be built around.

  • Decarbonisation of the energy economy whilst maintaining affordability and security of the energy supply.
  • Ensuring adequate investment in infrastructure to meet current and future needs and priorities.
  • Developing a sustainable health and social care system.
  • Unlocking long-term investment – and creating a stable environment for long-term investments.
  • Supporting established and emerging high-value industries – and building export capacity in a changing trading environment.
  • Enabling growth in parts of the UK outside London and the South East in order to increase the UK’s overall productivity and growth.
  • Industrial strategy should be about getting the public and private sectors to work together in a way that simultaneously achieves these goals and creates economic value and growing productivity

    Some policy areas to focus on

    The report highlights a number of areas in which current approaches fail. Here are a few:

  • our government institutions don’t work well enough; they are too centralised in London, and yet departments and agencies don’t cooperate enough with each other in support of bigger goals,
  • the approach government takes to cost-benefit analysis is essentially incremental; it doesn’t account for or aspire to transformative change, which means that in automatically concentrates resources in areas that are already successful,
  • our science and innovation policy doesn’t look widely enough at the whole innovation landscape, including translational research and private sector R&D, and the distribution of R&D capacity across the country,
  • our skills policy has been an extreme example of a more general problem of policy churn, with a continuous stream of new initiatives being introduced before existing policies have had a chance to prove their worth or otherwise.
  • The Industrial Strategy Commission

    The Industrial Strategy Commission is a joint initiative of the Sheffield Political Economy Research Institute and the University of Manchester’s Policy@Manchester unit. My colleagues on the commission are the economist Diane Coyle, the political scientist Craig Berry, policy expert Andy Westwood, and we’re chaired by Dame Kate Barker, a very distinguished business economist and former member of the Bank of England’s powerful Monetary Policy Committee. We benefit from very able research support from Tom Hunt and Marianne Sensier.

    It’s the economy, stupid

    There’s a piece of folk political science (attributed to Bill Clinton’s campaign manager) that says the only thing that matters in electoral politics is the state of the economy. Forget about leadership, ideology, manifestos containing a doorstep-friendly “retail offer”; what solely matters, in this view, is whether people feel that their own financial position is going in the right direction. Given the chaos of British electoral politics at the moment, it’s worth taking a look at the data to test this notion. What can the economic figures tell us about the current state of UK politics?

    Median household disposable income in 2015 £s, compared to real GDP per capita. ONS: Household disposable income and inequality Jan 2017 release

    How well off do people feel? The best measure of this is the disposable household income – that’s income and benefits, less taxes. My first plot shows how real terms median disposable household income has varied over the last 30 years or so. Up to 2007, the trend is for steady growth of 2.4% a year; around this trend we have occasional recessions, during which household income first falls, and then recovers to the trend line and overshoots a little. The recovery from the recession following the 2007 financial crisis has been slower than either of the previous two recessions, and as a result household incomes are still a long way below getting back to the trend line. Whereas the median household a decade ago had got used to continually rising disposable income, in the last decade it’s seen barely any change. To relate what happens to the individual household to the economy at large, I plot the real gross domestic product per head on the same graph. The two curves mirror each other closely, with a small time-lag between changes to GDP and changes to household incomes. Broadly speaking, the stagnation we’re seeing in the economy as a whole (when expressed on a per capita basis) directly translates into slow or no growth in people’s individual disposable incomes.

    Of course, not everybody is the median household. There are important issues about how income inequality is changing with time. Median household incomes vary strongly across the country too, from the prosperity of London and the Southeast to the much lower median incomes in the de-industrialised regions and the rural peripheries. Here I just want to discuss one source of difference – between retired households and non-retired households. This is illustrated in my second plot. In general, retired households are less exposed to recessions than non-retired households, but the divergence in income growth rate between retired and non-retired households since the financial crisis is striking. This makes less surprising the observation that, in recent elections, it is age rather than class that provides the most fundamental political dividing line.

    Growth in median disposable income for retired and non-retired households, plotted as a ratio with 1995 median values: £12901 for retired and £20618 for non-retired. ONS: Household disposable income and inequality Jan 2017 release

    What underlies the growing narrative that the public is tiring of austerity, as measured by the quality of public services people encounter day to day? The fiscal position of the government is measured by the difference between the money in takes in in taxes and the money it spends on public services – the difference between the two is the deficit. My next plot shows government receipts and expenditure since 1989. Receipts (various types of tax and national insurance) fairly closely mirror GDP, falling in recessions and rising in economic booms. For all the theatre of the Budget, changes in the tax system make rather marginal differences to this. Over this period tax receipts average about 0.35 times the total GDP. Meanwhile expenditure increases in recessions, leading to deficits.

    Total government expenditure, and total government receipts, in 2015 £s. For comparison, real GDP multiplied by 0.352, which gives the best fit in a linear regression of GDP to government receipts over the period. Data: OBR Historical Official Forecasts database.

    The plot clearly shows the introduction of “austerity” after 2010, in the shape of a real fall in government expenditure. But in contrast to the previous recession, five years of austerity still hasn’t closed the gap between income and expenditure, and the deficit persistently remains. The reason for this is obvious from the plot – tax receipts, tracking GDP closely, haven’t grown enough to close the gap. Austerity has not succeeded in eliminating the deficit, because economic growth still hasn’t recovered from the financial crisis. If the economy had returned to the pre-crisis trend by 2015, then the deficit would have turned to surplus, and austerity would not be needed.

    How do we measure economic growth? My next plot shows three important measures. The measure of total activity in the economy is given by GDP – Gross Domestic Product. This measure is the right one for the government to worry about when it is concerned whether overall government debt is sustainable – as my third plot shows, this is the measure of economic growth that the total tax take most closely tracks. It is certainly the government’s favourite measure when it is talking up how strong the UK economy is. But what is more important for the individual voter is the GDP per person. Obviously a bigger GDP doesn’t help an individual if has to be shared out among a bigger population, so it’s not surprising that household income tracks GDP per capita more closely than total GDP. As the plot shows, growth in GDP per capita has been significantly lower than total GDP, the difference being due to the growth in the country’s population due to net inward migration.

    Growth in real GDP, real GDP per capita, and labour productivity: ratio to 1997 value. Data: Bank of England: A millennium of macroeconomic data v 3

    Perhaps the most important quanitity derived from the GDP is labour productivity, simply defined as the GDP divided by the total number of hours worked. This evens out fluctuations due to business cycle, which affect the rates of employment, unemployment and underemployment.

    Growth in productivity – the amount of value created by a fixed amount of labour – reflects a combination of how much capital is invested (in new machines, for example) with improvements in technology, broadly defined, and organisation. Increasing productivity is the only sustainable source of increasing economic growth. So it is the near-flatlining of productivity since the financial crisis which underlies so many of our economic woes.

    It’s important to recognise that GDP isn’t a fundamental property of nature, it’s a construct which contains many assumptions. There’s no better place to start to get to grips with this than in the book GDP: a brief but affectionate history, by my distinguished colleague on the Industrial Strategy Commission, Diane Coyle. Here I’ll mention three particular issues.

    The first is the question of what types of activity count as a market activity. If you care for your aging parent yourself, that’s hard and valuable work, but it doesn’t count in the GDP figures because money doesn’t change hands. But if the caring is done by someone else, in a care home, that now counts in GDP. On the other hand, if you use a piece of open source software rather than a paid-for package, that has the effect of reducing GDP – the unpaid efforts of the open source community who made the software may make a huge contribution to the economy but they don’t show up in GDP. Clearly, social and economic changes have the potential to move the “production boundary” in either direction. The second question is more technical, but particularly important in understanding the UK in recent years. This is how the GDP statistics treat financial services and housing. Just because the GDP numbers appear in an authoritative spreadsheet, one shouldn’t make the mistake of believing that they are unquestionable or that they won’t be subject to revision.

    This is even more true when one considers the way that we compare the value of economic activity at different times. Obviously money changes in value over time due to inflation. My graphs attempt to account for inflation through simple numerical factors. In the case of household income, inflation was corrected for using CPI-H – the Consumer Prices Index (including housing costs). This is produced by comparing the price of a “typical” basket of goods and services over time. For the GDP and productivity figures, the correction is made through the “GDP deflator”, which attempts to map the changing prices of everything in the economy. The issue is that, at a time of technological and social change, relative values of different goods change. Most obviously, Moore’s law has led to computers get much more powerful at a given price; even more problematically entirely new products, like smart phones, appear. If these effects are important on the scale of the whole economy, as Diane has recently argued, this could account for some of the measured slow-down in GDP and productivity growth.

    But politics is driven by people’s perceptions; if many people think that the economy has stopped working for them in recent years, the statistics bear that out. The UK’s economy at the moment is not strong, contrary to the assertions of some politicians and commentators. A sustained period of weak growth has translated into stagnant living standards and great difficulties in getting the government’s finances back into balance, despite sustained austerity.

    We now need to confront this economic weakness, accept that some of our assumptions about how the economy works have been proved wrong, and develop some new thinking about how to change this. That’s what the Industrial Strategy Commission is trying to do.