The biggest current issue in the UK’s economic situation is the continuing slump in productivity. It’s this poor productivity performance that underlies slow or no real wage growth, and that also contributes to disappointing government revenues and consequent slow progress reducing the government deficit. Yet the causes of this poor productivity performance are barely discussed, let alone understood. In the long-term, productivity growth is associated with innovation and technological progress – have we stopped being able to innovate? The ONS has recently released a set of statistics which potentially throw some light on the issue. These estimates of total factor productivity – productivity controlled for inputs of labour and capital – make clear the seriousness of the problem.

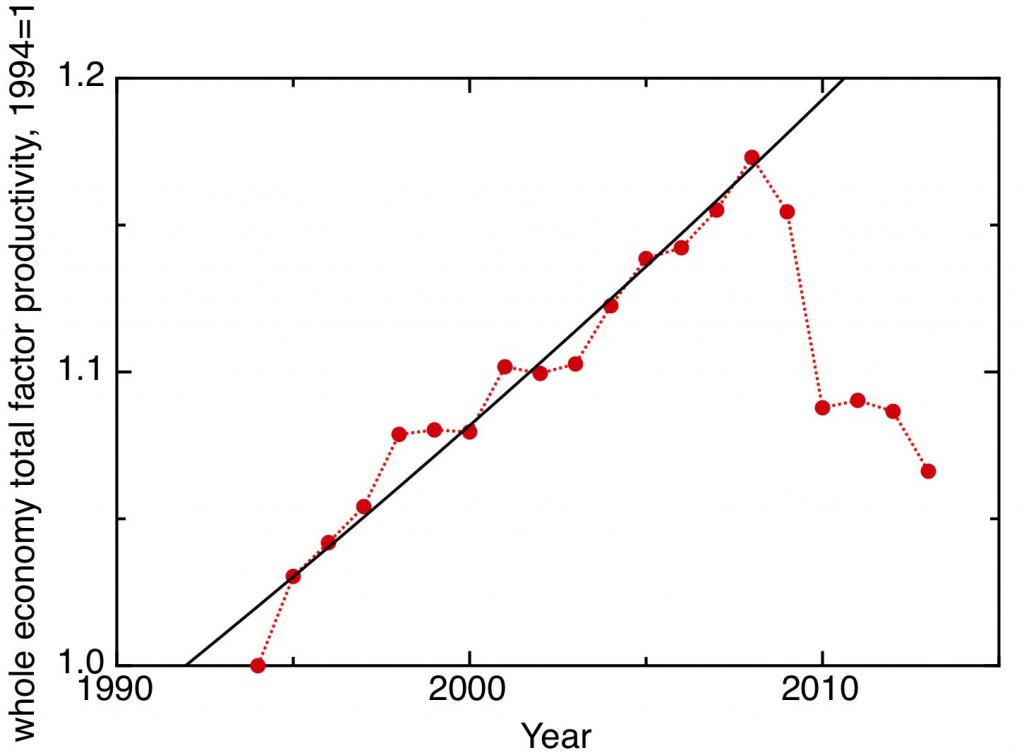
Here are the figures for the whole economy. They show that, up to 2008, total factor productivity grew steadily at around 1% a year. Then it precipitously fell, losing more than a decade’s worth of growth, and it continues to fall. This means that each year since the financial crisis, on average we have had to work harder or put in more capital to achieve the same level of economic output. A simple-minded interpretation of this would be that, rather than seeing technological progress being reflected in economic growth, we’re going backwards, we’re technologically regressing, and the only economic growth we’re seeing is because we have a larger population working longer hours.
Of course, things are more complicated than this. Many different sectors contribute to the economy – in some, we see substantial innovation and technological progress, while in others the situation is not so good. It’s the overall shape of the economy, the balance between growing and stagnating sectors, that contributes to the whole picture. The ONS figures do begin to break down total factor productivity growth into different sectors, and this begins to give some real insight into what’s wrong with the UK’s economy and what needs to be done to right it. Before I come to those details, I need to say something more about what’s being estimated here.
Where does sustainable, long term economic growth come from? Every year, on average, people get a little better at doing the things they did before, and sometimes they learn to do something new and more valuable than the thing they did before, that they stop doing. A factory can increase its production by employing more people or getting its workforce to work more hours, or it can buy more machines. But even if it uses no extra labour, and no extra capital, we’d expect it to be able to increase its output a little by organising the work better, by finding better ways of doing things. Economists try to formalise this insight by separating out from measured economic growth those bits that can be attributed to inputs of labour and capital – the bit that’s left, known after the originator of the method as the Solow residual, is held to be a measure of changes in the underlying productivity (known in the trade as total factor productivity or multi factor productivity), to be ascribed to technological, organisational and other forms of innovation.
The ONS has estimated total factor productivity changes for a number of different industry sectors. The classification is rather coarse, and the methodology for extracting the residual is model-dependent, to say the least, but the results are still instructive.

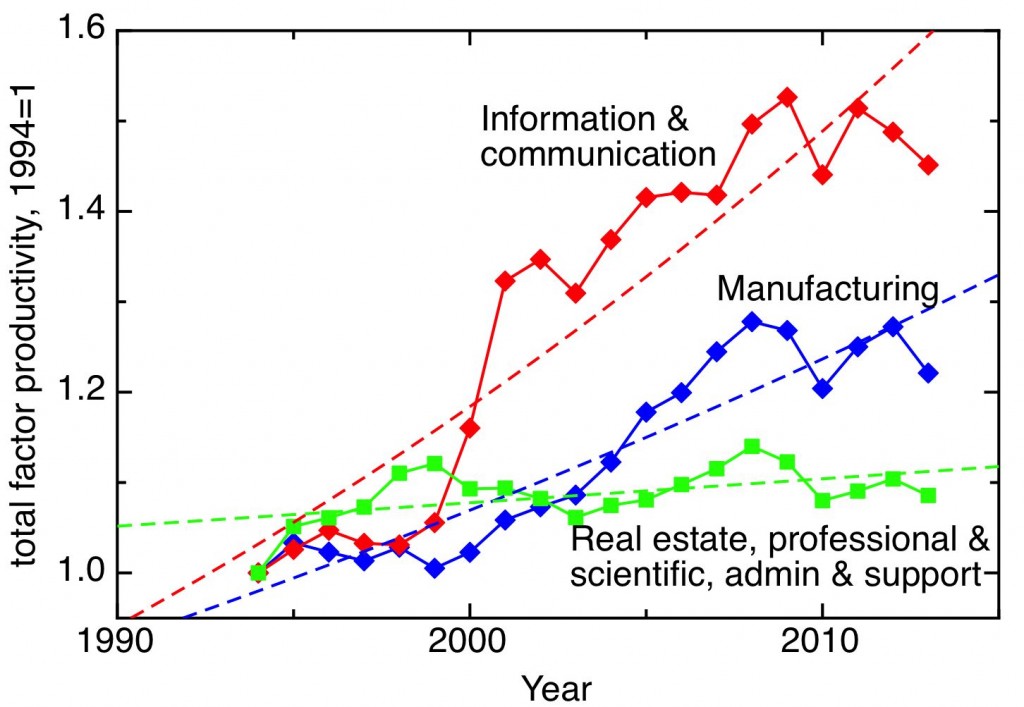
The plot shows the cumulative total factor productivity changes for three broad sectors. The Information and Communication sectors show growth which averages at around 2.3% per annum; perhaps one can also see in the data a rapid boost before 2000, which one might be tempted to ascribe to the rapid take-off of the commercial internet, followed by subsequent more steady growth, though one needs to be aware of the dangers of over-interpretation. Manufacturing also shows steady growth at the level of about 1.5% per annum. A third set of industries are classical parts of the service sector – real estate, professional and scientific services, administration and support. Here growth is much slower – about 0.2% a year. This all seems to make sense – productivity growth is harder to achieve in service sectors, and technological innovation makes more impact in the manufacturing and (especially) information and communication sectors. So the more an economy moves away from those high growth sectors, the slower its overall growth can be expected to be. But to understand fully the dramatic fall in whole economy total factor productivity that we’ve seen in the UK, we need to look at another couple of sectors.

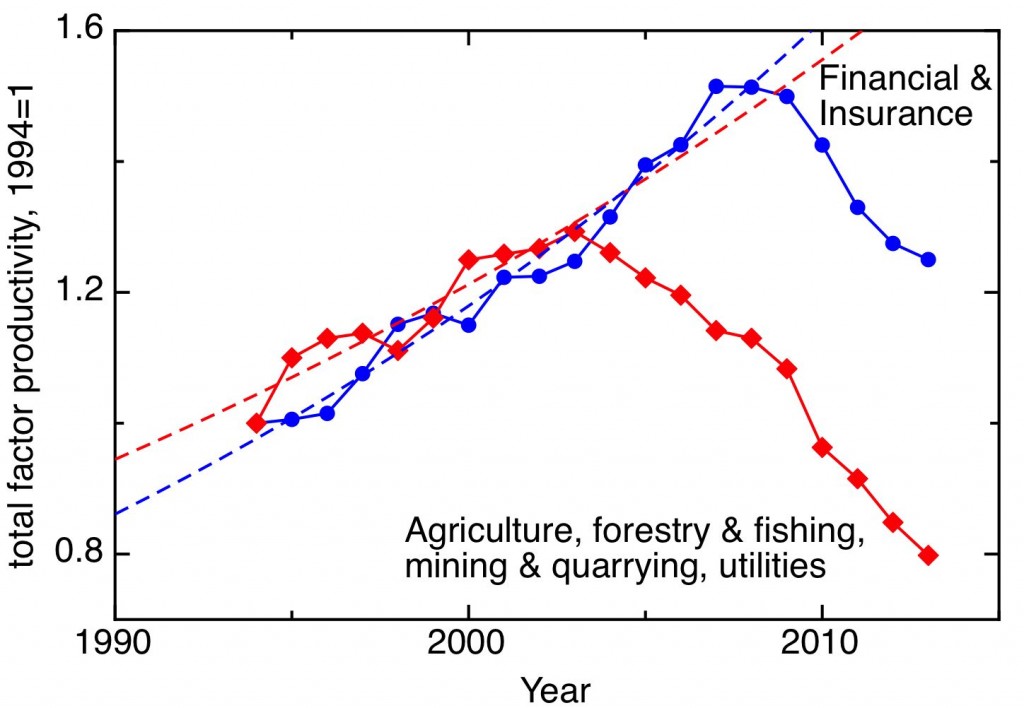
My final plot shows cumulative total factor productivity changes for agriculture, forestry and fishing, mining and quarrying, and utilities. This is a heterogenous group, but it shows a remarkable pattern, sustaining 2.5% per annum growth until 2004, when there is a remarkable transition. There may be a story about post-privatisation utilities here, but I believe the main action contributing to this pattern relates to North Sea oil. After a period in which North Sea oil was exploited with increasing efficiency, contributing substantially to the overall growth of the UK economy, the fields began to mature and become depleted, and it now takes increasing amounts of capital and labour to extract the same amount of economic value. The other sector shown looks remarkably similar. In the case of Finance and Insurance, growth at 3.2% per annum was abruptly reversed at the time of the 2008 financial crisis, since when we’ve seen dramatically diminishing returns.
So the UK does have economic sectors that are capable of leading the economy into sustained and sustainable long-term economic growth. The problem is that those sectors, which are technologically intensive and innovation-friendly, are too small. Manufacturing and ICT have been squeezed out by the apparently greater, but ultimately unsustainable, returns from oil and finance, and when those wells dried up the economy was left stranded.