I’ve been writing about the UK’s slowdown in productivity growth for about a decade, as I discussed here. I think it’s fair to say that this issue is well-understood amongst economists and some policy people, but productivity is an abstract concept. So, it’s perhaps unsurprising that, even now, the seriousness of our economic situation isn’t fully understood by commentators and journalists, let alone the wider public.
But there’s one way in which our productivity slowdown has very visible everyday consequences – and that’s in the end of wage growth. As my plot shows, wages have flatlined in the UK over last 15 years. This long period of stagnation is unprecedented in living memory, & marks a decisive & unwelcome break from the UK’s postwar economic trajectory.
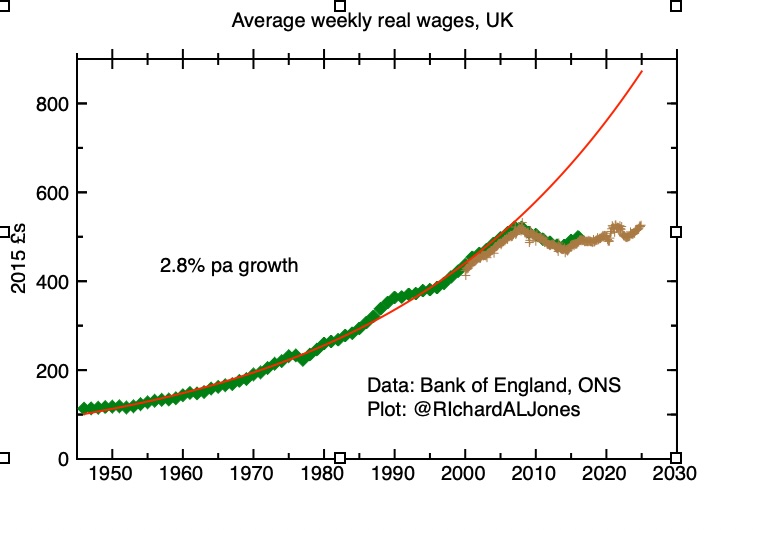
Average real weekly UK wages. Green: Composite Average Weekly Earnings series, corrected for inflation using consumer prices index. Thomas, R and Dimsdale, N (2017) “A Millennium of UK Data”, Bank of England OBRA dataset. Brown: ONS, Real Average Weekly Earnings, total pay, using CPI (seasonally adjusted). 18/2/2025 release.
The period from the end of the Second World War right up to the mid 2000s shows a remarkably consistent record of wage growth. There are moments of economic turbulence that are reflected in deviations from the trend of continuous 2.8% pa growth; a short-lived period of more rapid growth in the late 60s and early 70s – the Barber boom – with the excess growth unwinding in the mid-1970s crisis. And again, more rapid growth in the late 1980s Lawson boom, with the excess gains lost in weaker wage growth in the subsequent recession.
But nothing compares to the stagnation that we’ve seen since the global financial crisis. By the economic measure that arguably matters most to people at large – how their wages grow – the last decade and a half is by far the worst period since the war. In comparison, the economic turbulence of the 1970’s looks like a golden age.
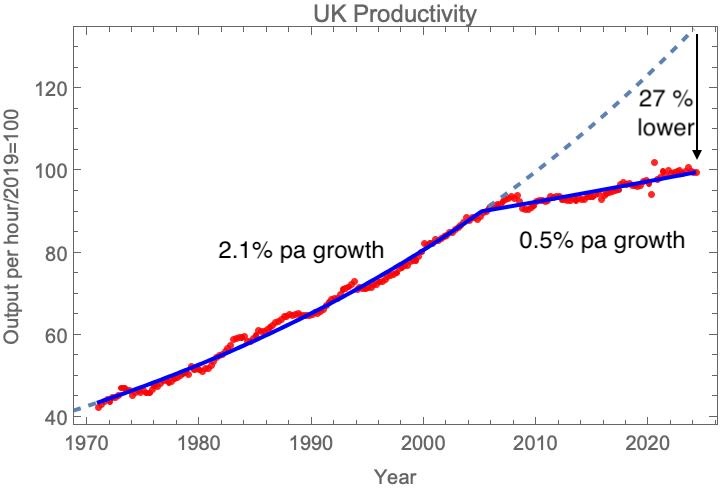
UK labour productivity, index 2022=100. Data: ONS, 15/11/2024 release. Line: non-linear least squares fit to two exponential functions, continuous at the break point, which occurs at 2005 for the best fit. See When did the UK’s productivity slowdown begin? for more details of the fitting approach.
The end of wage growth in the UK is a direct consequence of the end of productivity growth. It’s worth making a couple of points about the link between productivity growth and wage growth. In the USA, that link is weaker than it was. But the UK is not the USA; while in the USA the labour share of GDP – the share of overall economic activity that goes to wages, rather than rewarding the owners of capital – has significantly fallen, this is not so in the UK. For whatever reason, in the UK, over the last decade, the labour share of GDP has actually increased.
Of course, my plot of wage growth presents a single average, and it’s a fair question to ask how the distribution of wages has changed with time – has this become more unequal, with more of the benefits of productivity growth going to higher earners? It turns out that, while there was a substantial increase in inequality in the 1980s, overall measures of income inequality have been relatively steady since then.
The wage growth plot explains so much about state of UK politics today. Few people have an intuitive feel in the abstract for what productivity growth – or its absence – means, but the sense of stalling living standards, and worse prospects for young people, is all too palpable.