Lessons from the gas price spike

On April 1st this year, the average UK household will see its annual energy bills rise from £1,277 to around £2,000 a year, according to the Resolution Foundation. After 10 years of stagnant wages – this itself a result of the ongoing productivity growth slowdown, there’s a clamour for some kind of short term fix for a potential political crisis, made worse by a forthcoming tax rise. Even more ominously, an unfolding geopolitical crisis over a conflict between Russia and Ukraine may interact with this energy crisis in a potentially far-reaching way, as we shall see.


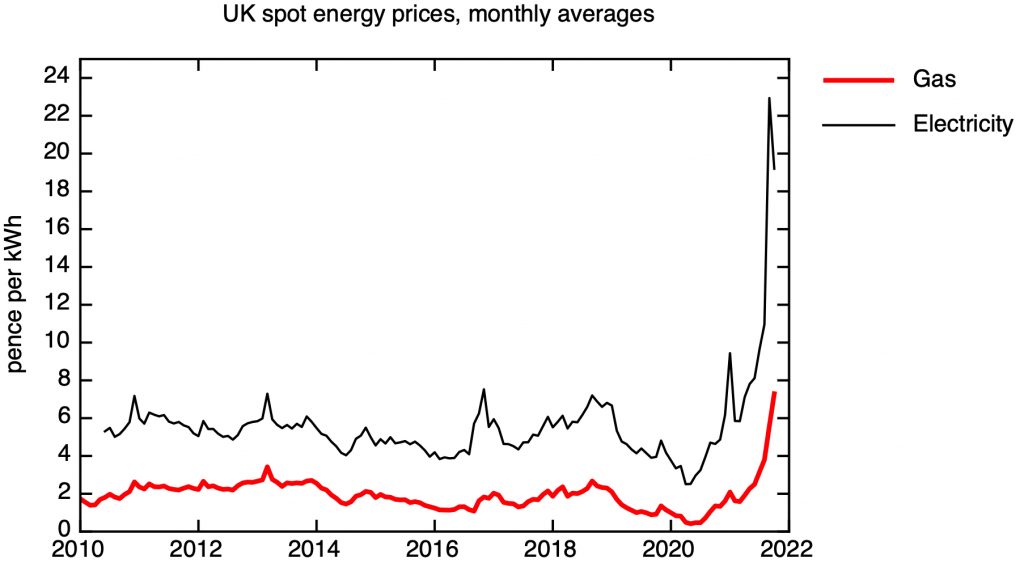
UK gas and electricity spot prices (monthly rolling average of “day-ahead” prices). Data: OFGEM

My first plot shows the scale of the crisis. This shows the wholesale, spot prices of gas and electricity since 2010. I don’t want to dwell here on the dysfunctional features of the UK’s retail energy market that have led to the failure of a number of suppliers, or to look at the short-term issues that have exacerbated a current supply squeeze. Instead, it’s worth looking at the longer term implications for the UK’s energy security of this episode of market disruption, and to try to understand how we have been led to this state by global changes in energy markets and UK policy decisions over decades.

Natural gas matters existentially for the UK’s economy, because 40% of the UK’s demand for energy is met by gas, and without sufficient supplies of energy, a modern economy and society cannot function. The price of electricity is strongly coupled to the price of gas, because 34% of our electricity (in 2020) was generated in gas-fired power stations, compared to 15% from nuclear and 23% wind. But generating electricity only accounts for 29% of our total demand for gas. The biggest fraction – 37% – is used for heating our houses, with another 12% is directly burnt in industry, to make fertiliser, cement and in many other processes.

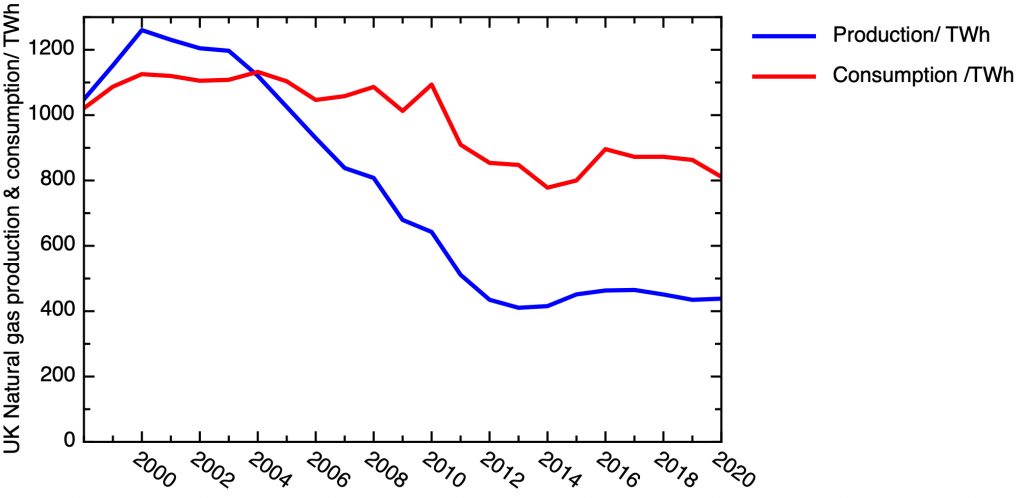
To understand why the wholesale price of gas matters so much, we need to understand a couple of ways in which the UK’s energy landscape has changed in the last twenty years. The first – the UK’s own balance between production and consumption – is shown in the next plot. Since 2004, the UK has gone from being self-sufficient in gas to being a substantial importer. Production of North Sea gas – like North Sea oil – peaked in the early 2000s, and has since rapidly dropped off, as the gas fields most easily and cheaply exploited have been exhausted.


Gas production and consumption in the UK. Data: Digest of UK Energy Statistics 2021, table 4.1.

The second consideration is the nature of the international gas market. A few decades ago, natural gas was a commodity that was used close to where it was produced – it could not be traded globally. But since then an infrastructure has been developed to transport natural gas over long distances; a network of intercontinental pipelines have been built, so gas produced, for example, in Arctic Siberia can be transported to markets in Western Europe. And the technology for shipping liquified natural gas in bulk has been developed, allowing gas from the huge fields in Qatar and Australia, and from the USA’s shale gas industry, to be taken to terminals across the world. This means that a worldwide gas market has been developed, tending to equalise prices across the world. A liquified natural gas tanker can leave Qatar, the USA or Australia and choose to take its cargo to wherever the price it can fetch is highest.

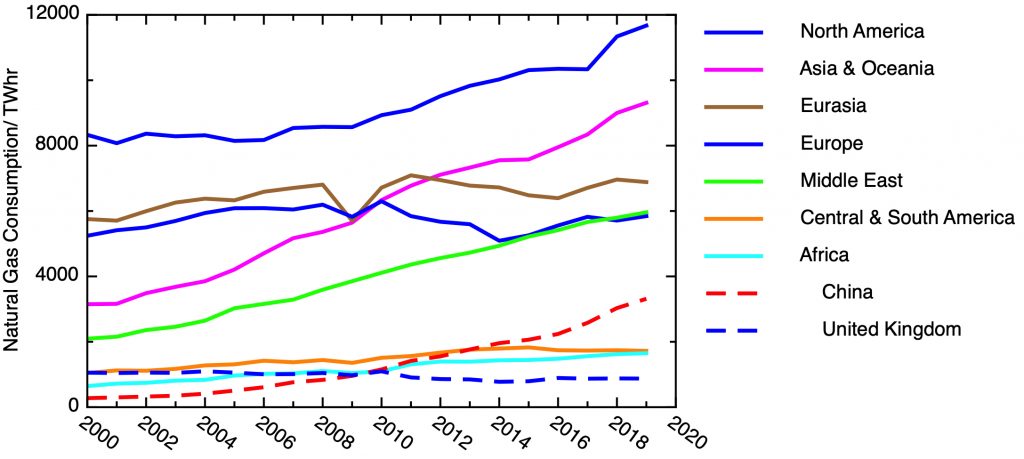
The combination of the UK’s dependency on gas imports means that the prices UK households and industry have to pay for energy reflect supply and demand on a global scale. My next plot shows how global demand has changed over the last couple of decades. The UK’s demand has held steady – the UK’s “dash for gas” represented an early energy transition from extensive use of coal to natural gas. This was a positive change that has reduced the UK’s emissions of greenhouse gases. Now other countries are following in the UK’s footsteps – again, a positive development for overall world greenhouse gas emissions, but putting huge upward pressure on gas supplies. This stresses that the UK is a minor player in world gas markets; its consumption accounts for about 2% of world demand.


World gas consumption by continent, together with China and UK. Data: US Energy Information Administration

Where is this gas coming from? The largest net exporter, as shown in my next plot, is Russia. There’s an ominous echo of the 1970’s and its linked energy, economic and political crises, as dominant energy suppliers realise that withholding energy exports can be a powerful weapon in geopolitical conflicts. As it happens, the UK’s gas imports come primarily from Norway, by pipeline, and Qatar, through LNG imports by ship. But this doesn’t mean that the UK won’t be affected if Russia chooses to exert pressure on Europe by throttling back gas exports. There’s a global market – if Russia cuts off supplies to Germany and Central Europe, Germany will seek to replace that by buying gas from Norway and on the world LNG market, and the prices the UK has to pay will rocket.


Top gas net exporters (i.e. exports less imports).Data: US Energy Information Agency

What should the UK do about this energy crisis?

We can discount straight away the suggestion made by veteran Thatcherite and Eurosceptic MP, Sir John Redwood, that the UK should simply produce more gas of its own. The UK is a small-scale participant in a global market. Even doubling its gas production would make no impact on the global balance of supply and demand, so prices would be unaffected. It’s true that if the gas was produced by a government-owned organisation, the rent – the difference between the market price and cost of production – would be captured by the UK state rather than having to be handed over to the governments of major exporters like Qatar, Norway and Russia. But British Gas was privatised in 1986.

The reason the UK ran down its production was that governments in the 1980’s made a conscious decision that energy should be left to the market, and the market said that it was cheaper to import gas than to produce it from the North Sea (and even more so than to develop a fracking industry in Sussex and the rural Pennines). One can’t help getting the impression that UK politicians like John Redwood are in revolt against the consequences of the national economic settlement that they themselves created.

In fact, there is nothing fundamental the UK can do now apart from strengthen the social safety net for the poorest households, accepting the pressure to increase taxes this leads to. Less politically visible, but nonetheless important, is the pressure high gas costs will put on energy-using industries. The reality is that, as a net importer of energy, higher gas prices inevitably lead to a real loss of national income. Energy infrastructures take many years to build, so all we can do now is look back at the things the UK should have done a decade ago, and learn from those mistakes so that we are in a better position a decade on from now.

What the UK should have done is to reduce the demand for gas through an aggressive pursuit of energy efficiency measures, and to increase the diversity of its energy sources by accelerating the development of other forms of (low-carbon) electricity generation. It failed on both fronts.

In 2013, the Coalition government reduced spending on energy efficiency measures as part of a campaign to “cut the green crap”; the result was a precipitous drop in measures such as cavity wall insulation and loft insulation. In 2015, the zero-carbon homes standard was scrapped, with the result that new housing was built to lower standards of energy efficiency. Recall that 37% of the UK’s gas demand is for domestic heating, so the UK’s poor standards of home energy efficiency translate directly into increased demand – and, with the current high prices, higher bills for consumers. “Cutting the green crap” turned out to be a costly mistake.

It is true that the UK has brought on-stream a significant amount of offshore wind capacity. However, too much of this capacity has been offset by the decline of the UK’s existing nuclear fleet, now approaching the end of its life. The UK government has committed to a programme of nuclear new build, but this programme has stalled. In 2013, I wrote that the nuclear new build programme was “too expensive, too late”, and everything that has happened since has born that diagnosis out.

There’s a more general lesson to learn from the current gas price spike. For some decades, the fundamental underpinning of the UK’s energy policy is that the market should be left to find the cheapest way of delivering the energy the nation needs. In the last decade, the government has intervened extensively in that market to promote one policy objective or another. We’ve seen contracts for difference, capacity markets, renewable obligation certificates – the purity of a free market has long since been left behind. But there’s still an underlying assumption that someone will be running a spreadsheet to calculate a net present value for any new energy investment.

Cost discipline does matter, but it’s important to recognise that these calculations, for investments that will be generating income for multiple decades, rest on projections of market conditions running many years in the future. But what this current episode should tell us is that the future course of energy markets is beset by what the economists call “Knightian uncertainty”. On the reliability of predictions of future energy prices, the lesson of the past, reinforced by what’s happening to gas prices now, is that no-one knows anything.

Energy can’t be left to the market, because the future state of the market is unknowable – but the need for energy is an inescapable ingredient of a modern economy and society. For something that is so important, building resilience into the system may be more important than maximising some notional net present value whose calculation depends on guesses about the state of the world over decades. This is even more true when we factor in the externalities imposed by the effect of fossil fuels on climate change, whose cost and impact remains so uncertain. To be more positive, there are uncertainties on the upside – the reductions in cost that an aggressive programme of low carbon research, development and deployment-driven innovation could bring. Rather than relying entirely on market forces, we have to design a resilient zero carbon energy system and get on with building it out.

Levelling up and R&D – the case for innovation deals

The UK has a profound problem of regional disparities in productivity performance, with second tier cities that underperform compared to expectations based on their size, and deindustrialised towns and urban areas that have failed to find productive new economic roles. Productivity growth arises from innovation, taking that term in its widest sense, and formal research and development (R&D) is one underpinning of innovation, so it’s worth asking whether there is a link between geographical disparities in R&D intensity and regional economic underperformance.

The distribution of research and development investment in the UK – especially in the public sector – is currently highly skewed to the prosperous Greater South-East. London, together with the two subregions containing Oxford and Cambridge, account for 46% of all public and charitable spending on R&D, with 21% of the UK’s population. We know that there are substantial spillovers from public and private R&D; econometric estimates suggests that a 10% rise in public R&D would raise private total factor productivity growth by 0.03 percentage points per annum, with an estimated return on public R&D of 20% per annum, so a correlation between regional R&D intensity and productivity might be expected. But does it matter where the R&D is done?

R&D matters not just for the knowledge it generates and the inventions it produces, but in the capacity of firms to absorb new technology. It’s certainly possible to innovate without formal R&D – through the development of new business models, or through the acquisition of new equipment. But in the UK R&D still takes the largest share of firms’ innovation expenditure.

One key justification for public support of R&D is that firms are unable to capture the whole benefit of the research they undertake – there are “spillover” benefits to other firms that are able to copy the innovations of the leaders. The geographical aspect of these spillovers is captured in the importance of clusters, recognised in economic writing since the time of Alfred Marshall. A successful regional cluster draws on a set of collective resources and knowledge, much of it tacit, that drives innovations in both products and processes.

This set of collective resources has been called by US researchers Pisano & Shih the “industrial commons”. A successful industrial commons is rooted in large anchor companies & institutions, together with networks of supplying companies; it is characterized by both informal knowledge networks and formal institutions for R&D, training and skills. International examples include advanced manufacturing in Lombardy, Italy, ICT hardware in Hsinchu, Taiwan, and in the UK, biotechnology in Cambridge. A goal of regional economic policy should be to consciously attempt to rebuild the industrial commons in places where de-industrialisation has caused them to wither.

Public R&D in the UK is carried out in universities, and increasingly, in specialist research institutes such as the Crick Institute in London. In comparison to other developed nations, one type of institution that is relatively lacking in the UK are translational and applied research institutes such as the Fraunhofer Institutes in Germany, IMEC in Belgium and the Industrial Technology Research Institute in Taiwan. Such institutes may focus more on industry engagement, process innovation, the wider diffusion of existing innovations, and in skills development than is possible in institutions more focused on basic research, and they can play an important role in nucleating and developing an innovation ecosystem of the kind that can anchor an industrial commons.

Recent policy developments in the UK do give encouraging signs that some of these issues are being recognised. The UK’s Innovation Strategy, published in July 2021, stated that “we need to ensure more places in the UK host world-leading and globally connected innovation clusters, creating more jobs, growth and productivity in those areas”, while the October 2021 Comprehensive Spending Review announced a £5.2 billion increase in government R&D spending from FY 20/21 to 24/25, and made the important commitment that “the government will ensure that an increased share of the record increase in government spending on R&D over the SR21 period is invested outside the Greater South East”.

Further details for how this increase will be delivered are expected in the imminent “Levelling Up” White Paper. One possibility, signalled in the Budget, is that the Catapult Network might play an important role. These centres represent a recent UK initiative to create the kind of translational and applied research institutes discussed above; it would be valuable to develop these further in a way which more explicitly recognizes their potential for regional development.

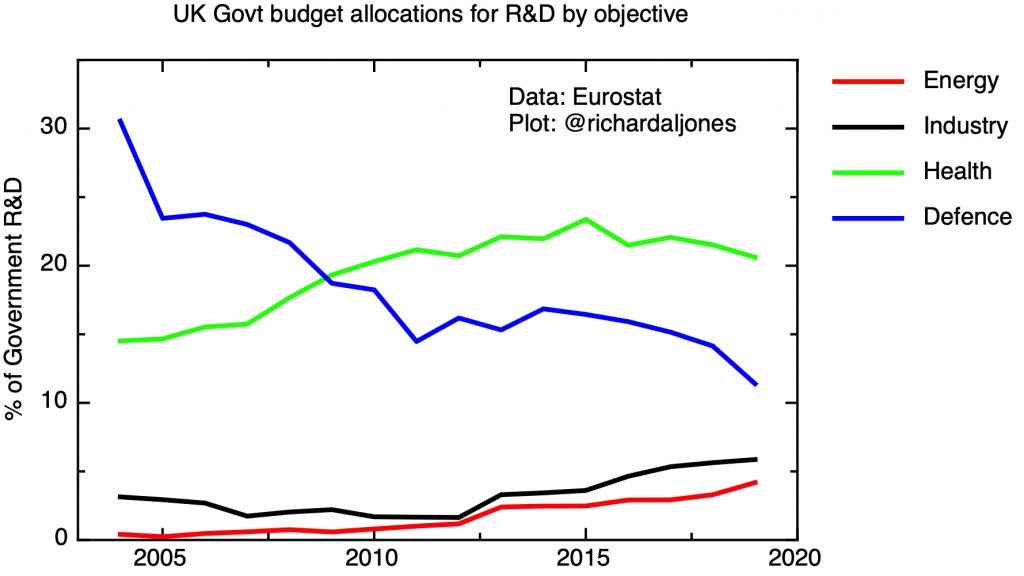
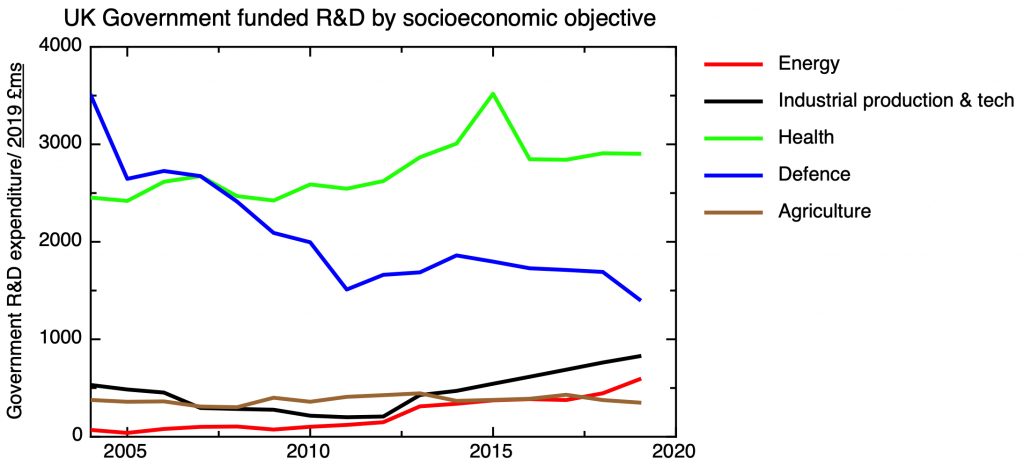
The White Paper is being driven by the newly renamed Department of Levelling Up, Housing and Communities, but it will need support across the whole government, including not just the Department of Business, Energy and Industrial Strategy, but in other departments that have received substantial increases in their R&D budgets, especially Defence and Health and Social Care.

For increased R&D spending to have a material effect on the UK’s regional productivity imbalances, it will be important to avoid two pitfalls. The first is to recognise the importance of scale. Too often previous attempts to boost innovation in the regions – for example, by the English Regional Development Agencies in the 2000’s – have been worthwhile in themselves, but implemented at a scale too small to make a material difference to regional economies.

For example, the three Northern RDAs spent £157m on innovation in the three years of the 2004 spending review period – while government and HE R&D spending over the same period was £20.3 billion in total, of which £4 billion was in the North.

To make a material impact on regional inequality of R&D spending, the resources deployed need to be at least an order of magnitude bigger; a crude calculation shows that to level up per capita public spending on R&D across the UK to the levels currently achieved in the Greater Southeast, additional annual spending of more than £4 billion would be needed. If the government is serious about devoting a significant share of the £5.2 billion R&D uplift to “levelling up”, the possibility now exists to make a real change, without jeopardising the existing excellence of R&D clusters in the Greater SE.

The second is to ensure that spending priorities aren’t defined entirely “top-down”, from Whitehall or Swindon. To be effective in driving productivity growth, government spending on R&D must be deployed in a way that maximises its effect to “crowd in” private sector investment. This needs to be done in a way that works with the grain of local economies, building on the existing business base and complementing their existing assets and endowments. This will need local knowledge that it is unreasonable to expect national agencies to possess.

The current geographical imbalances in R&D spending across the UK are of long-standing, and they won’t change without a significant change in the way funding is allocated. One way of doing this would be simply to devolve government R&D funding to cities, regions and nations to make their own decisions in the light of their knowledge of local economies.

There are potential objections to this approach. Given the very patchy nature of devolution across the UK – and especially in England – places may lack institutions with the analytical capacity and the legitimacy to set priorities and make good funding decisions. There’s a further risk that a lack of coordination, between different regions and cities, and between cities and central government agencies, leads to duplication, unhelpful competition and lack of coherence with national policy and priorities.

The idea of an “innovation deal” provides a way forward that answers these potential objections. In an innovation deal, cities and regions would develop a strong institution to implement an evidence-based local innovation strategy. Such an agency should be based on a coalition of private sector actors, local government (e.g. Mayoral Combined Authorities) and regional R&D assets, and would give central government and its agencies confidence that there was a trusted local partner that would take responsibility for implementing an innovation strategy and developing the region’s innovation ecosystem.

These agencies would give a robust mechanism whereby central government and cities and regions could work together to co-create a set of priorities for those new investments, many of which would be focused on translational research and skills development, that would both be most effective for improving regional productivity, while at the same time supporting national innovation priorities, such as the 2050 Net Zero target and a drive to reduce inequalities in health outcomes across the nation.

In Greater Manchester, a private sector led partnership of business, the Mayoral Combined Authority, and universities has come together to create “Innovation GM”, with an invitation to central government to work with them to make R&D led levelling-up of regional productivity a reality. Other cities and regions are engaged in similar initiatives, so there is now a chance to inject a new, place-led, dimension into innovation policy.

The substantial uplift in R&D funding announced in the October 2021 budget, together with the commitment to spend more of this uplift outside the Greater Southeast, offers a once-in-a-generation chance to make a material difference to the UK’s persistent imbalances in R&D spending. Innovation deals with cities and regions offer mechanisms for maximising the impact of this spending uplift on regional productivity.

When the promise of economic growth is not fulfilled

It’s been widely reported that the government is considering lowering the earnings threshold at which people need to start paying back their student loans. Let’s leave aside, for a moment, the question of whether it’s good economic sense for some graduates, at relatively early stages of their careers, to be facing very high effective marginal tax rates, or indeed bigger questions of the fairness of the current split in tax burden between young and old. The fundamental reason this change is having to be considered reflects the fact that, contrary to the expectations of economists and the experience of the rest of the post-war period, average wages in the UK have been stagnant for a decade. Worsening terms for student loans represent just one example of the way we’re starting to see the unfulfilled promise of continued economic growth having depressing and unwelcome real-world effects.

The key number in understanding the UK’s byzantine student finance system is the so-called RAB charge. When a student goes to university, the Government fronts up a fee to the university – currently £9250 a year (except in Wales) – and in some circumstances advances a loan for living expenses. In return, the student agrees to repay the loan in monthly instalments that depend on their income, with any unpaid portion of the loan being written off after 30 years. So, the fraction of the money the government doesn’t get back depends on the average level of wages, projected 30 years into the future. The less wages rise, the higher the fraction of the loan the government doesn’t recover. This fraction is known as the RAB charge, and is counted as a cost in the government’s accounts.

When the current student loan scheme was introduced by the Coalition government in 2012, the RAB charge was expected to be about 30%. As the years went on, this number increased: for 2014, it was estimated at 45%, and by 2020, the RAB charge stood at 53% – the government expected less than half of the student loans advanced that year to be repaid. The total advanced by the government under the student loan scheme that year was £19.1 billion, so under the original assumptions of the scheme, the cost to the government would have been £5.7 billion. Instead, under the current assumptions, the cost is now more than £10 billion, largely due to the failure of the average wage growth anticipated in 2012 to materialise.

Much of the discussion around the cost of the student finance system now revolves around the calculated return to individual degrees, by subject and institution. The creation of a large data-set linking subject studied to income achieved makes it possible to identify those degrees that provide the highest and lowest financial returns. This is fascinating and useful data, but there’s a danger of misinterpreting it, to suggest that the problem of the high cost to the government of the current HE funding system is the result of bad choices by individuals, and of universities offering “poor value” degrees. Instead, the fundamental issue is a collective one, of the economy’s failure over the last decade to deliver the progressively rising wages we had come to expect in the post-war period.

It’s clear from the data that if an able individual wants to maximise their earning power, they should do a degree in economics rather than, say, music. But from that, it doesn’t follow that the nation would be more prosperous if every student studied economics. There is an issue about how to find the optimum distribution of subjects studied that matches the changing needs of an economy, but the first order determinant of the overall cost of the HE funding system is the average wage that the economy can sustain. The problem we have isn’t low value degrees, it’s a low value economy.

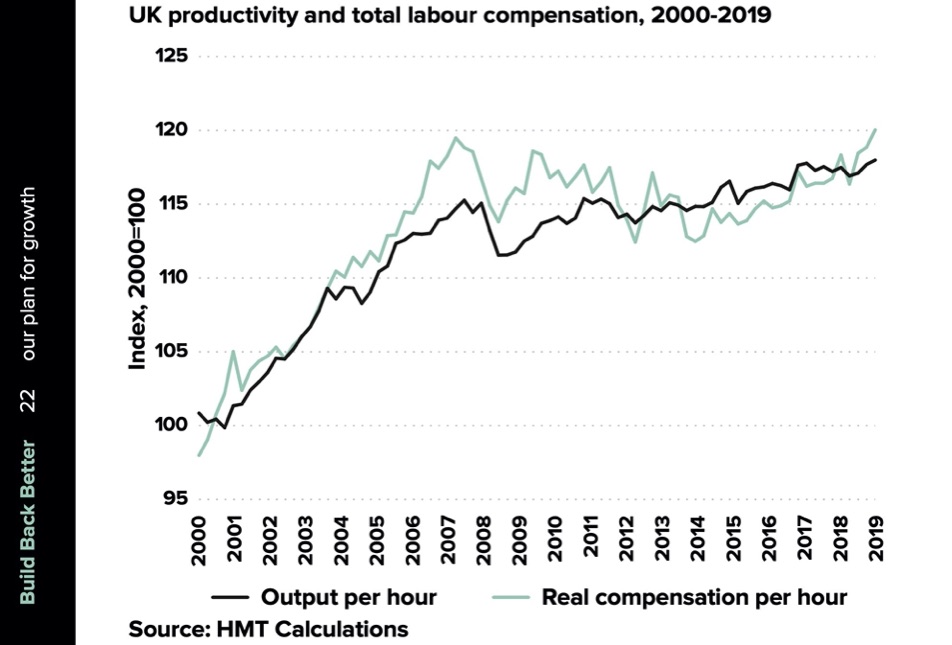
The reason wages have been stagnant is straightforward – the regular, year-on-year, increases in productivity we had become accustomed to in the post-war period stopped around the time of the global financial crisis, and have not yet returned. Labour productivity measures the value added, on average, by an hour of work, so given a relatively constant split between the reward to capital and labour, we would expect labour productivity and average wages to track each other quite closely. My first plot – taken from the Treasury’s March 2020 Plan for Growth – shows that this relationship has indeed held quite closely in the UK over the last twenty years.

The relationship between labour productivity (output per hour) and total labour compensation. From HM Treasury’s Build Back Better: our plan for growth, March 2021.

As the Treasury said in the March 2021 Plan for Growth, “In the long run, productivity gains are the fundamental source of improvements in prosperity. Productivity is closely linked to incomes and living standards and supports employment. Improvements in productivity free up money to invest in jobs and support our ability to spend on public services.” The corollary of this is that, without productivity growth, we see stagnant living standards, and tighter fiscal conditions, leading to poorer public services. The story of the swelling RAB charge for the student finance system is just one example of the malignant effect of productivity stagnation on public finances.

It’s conventional wisdom to look back to the 1970’s as the nadir of UK economic performance. But measured by productivity growth, the last decade has been much worse. From 1971 to 2006, labour productivity grew at a remarkably steady rate of about 2.3% a year – and this provided the material for sustained growth in living standards. But since 2010, trend growth has remained stubbornly low – at less than 0.4% a year.

Labour productivity since 1970, with the latest prediction from the Office of Budget Responsibility. Sources: ONS, OBR Economic and Fiscal Outlook October 2021.

What are the chances of this dismal trend being broken? The forecasts of the Office of Budgetary Responsibility are based on the expectation of a modest upturn in productivity. The OBR has been predicting a recovery in productivity growth every year since 2010, and this recovery has so far failed to materialise. I’ve written a lot about productivity before (see e.g. The UK’s top six productivity underperformers,
Should economists have seen the productivity crisis coming? and Innovation, research and the UK’s productivity crisis), and I’ll surely return to the subject. In the meantime, I don’t understand why the OBR think it will be different this time, particularly given the additional headwinds the economy now faces.

Many – if not most – of the big economic transactions made, both by individuals and by governments, amount to shifting saving and consumption backwards and forwards in time. Whether it’s individuals getting a mortgage on a house, or saving for a pension, or governments borrowing money now on the basis of the expectation of future tax income, we are making assumptions about how our future income, at a personal or national level, will grow. Governments don’t repay the national debt – they hope the economy will grow fast enough to keep the interest payments manageable. If our assumptions about income growth turn out to be over-optimistic the ramifications are likely to be unpleasant. The slow unravelling of the 2012 student finance settlement is just one example.

UK science after the spending review

On October 27th, the UK government set out its spending plans for the next three years, in a Comprehensive Spending Review. Here I look at what this implies for the research and development budget.

The overall increase in the government’s R&D budget is real and substantial, though the £22 billion spending target has been postponed two years

The headline result is that real, substantial increases in government R&D spending have been announced. The background to this is a promise made in the March 2020 budget that by 2024/25, government R&D spending would rise to £22 billion a year. Of course, after the pandemic, the UK’s fiscal situation is now much worse, so it isn’t surprising that the date for reaching this figure has been set back a couple of years.

I wrote earlier about the suspicions in some policy circles that the government might attempt to game the figures to claim that the target had been reached – On the £22 billion target for UK government R&D
I’m glad the government hasn’t done this, and instead has set out a path which does deliver real, and substantial increases in R&D spending.

This is made clear in my first figure, which shows the trajectory of R&D spending since 2008. The Comprehensive spending review delivers an increase next year very much in line with increases in previous years, but the increase from 2022/23 to 2023/4 is very substantial – and in fact would put R&D spending on the trajectory that would be needed to achieve the £22 billion target by the original date of 24/25. I understand that the slower increases after that date are connected with some technicalities about the path of the UK’s contributions to the EU Horizon R&D programme, but more on that below.

Comprehensive Spending Review commitments for total government spending on R&D, in current money, compared with historical actual spending. Sources: ONS, October 2021 HMT Red Book.

Of course, these figures are uncorrected for inflation – and given that we’re currently seeing a rate of price increases higher than we’ve seen for some time, this is likely to make a big difference. I’ve attempted to show the effect of that in the next plot, which shows both the historical and projected R&D spending expressed in constant 2019 £s. I’ve made the correction using the Consumer Price Index, and used the OBR’s latest central prediction of future CPI inflation (of course, this may turn out to be optimistic) to deflate planned future R&D spending.

This plot shows that R&D spending stagnated in the early 2010’s, with a gently increasing trend beginning in 2015. In real terms R&D spending only recovered beyond the previous 2009 peak in 2018. The increase from 2022/23 to 2023/4, even after the inflation correction, is significantly greater than anything we’ve seen in the last decade.

If we look ahead to 2026/7, by when the £22 bn nominal total is planned to be reached, we can expect the real value of this sum to have been significantly eroded by inflation. On this, rather uncertain, projection, we project a 47% real increase on the 2009 previous peak.

Comprehensive Spending Review commitments for total government spending on R&D, correct for inflation by CPI, compared with historical actual spending. Sources: ONS, October 2021 HMT Red Book, OBR Economic and Fiscal Outlook October 2021 (future CPI predictions).

All areas of R&D spending see real increases, but there’s slight shift in balance to applied and department research

Even though most attention falls on the R&D money the government spends in universities through research councils and research block grants, this actually forms a minority of the government’s total R&D spending. Other departments – notably the Department of Health and Social Care and the Ministry of Defence – have significant R&D budgets focused on more applied research connected to their core goals. The Department of Business, Energy and Industrial Strategy holds the overall budget for the UK’s main funding agency, UK Research and Innovation, but this also includes the innovation agency Innovate UK, which has a more business focus, and various pots of money directed at mission-orientated research, most notably the Industrial Strategy Challenge Fund.

This is illustrated in my next plot, showing planned R&D spending in real terms. This shows a gentle but significant rise in what the government now calls the UKRI core research budget – mainstream research supported by the research councils and national academies, and the block grant distributed to universities by Research England and corresponding agencies in the devolved nations. The innovation agency Innovate UK is part of UKRI, but has been helpfully broken out in the figures; although this is a relatively small part of the overall picture, as we’ll see this will see substantial increases.

What isn’t clear to me, at the moment, is how the R&D spending currently ascribed to the rest of BEIS will be allocated. I believe this includes funds currently distributed by UKRI, but not included in the “core research” line, which would include the Industrial Strategy Challenge Fund and the Strength in Places fund. It also includes various public/private collaborations like the Aerospace Technology Initiative. We await details of how these funds will be allocated; as the plot makes clear, this is a very substantial fraction of the total.

The other uncertainty surrounds the cost of associating to the EU’s research programmes, particularly Horizon 2020. The UK’s withdrawal agreement with the EU agreed to associate with the EU’s R&D programmes, as widely supported by the UK’s scientific community, the UK government, and our partners in Europe. But the final agreement with the EU has not yet been signed by the Commission, who are linking its finalisation with all the other outstanding issues in dispute between the UK and the EU, notably around the Northern Ireland protocol.

I understand that the commitment has been made that, if association with Horizon is stymied by these entirely unrelated problems, the full amount budgeted for the Horizon association fee will be made available to support R&D in other ways. It’s no secret that some in government would prefer this outcome, and the significant scale of the funds involved may tempt some in the scientific community to support such alternative arrangements, though it may be worth reflecting on the likely solidity of that commitment, as well as stressing the non-monetary value of the international collaborations that Horizon opens up.

Breakdown of Comprehensive Spending Review commitments for government spending on R&D by department/category, corrected for inflation. Source: October 2021 HMT Red Book, OBR Economic and Fiscal Outlook October 2021 (future CPI predictions).

The relative scale of the increases becomes more clear in my next plot, where I’ve plotted the real terms increase relative to the 2021/22 starting point. This emphasises that in relative terms, the big winners from the budget uplift are the other departments – dominated by the Ministry of Defense – and the innovation agency Innovate UK. The Department of Health and Social Care – which holds the budget of the National Institute for Health Research – also does well.

The increase in the UKRI core research line is real, but significantly smaller. This does indicate a shift in emphasis to applied research and development, including R&D in support of other government priorities. However, one shouldn’t overstate this – there’s a lot of inertia in the system and the UKRI core research budget is still a very large proportion of the total. As a fraction of total government R&D, UKRI core research is planned to fall slightly from 32% of the total to a bit less than 30%.

Increases in spending on R&D by department/category, corrected for inflation, relative to 2021/22 value (index=100). Source: October 2021 HMT Red Book, OBR Economic and Fiscal Outlook October 2021 (future CPI predictions).

R&D spending, place, and the “levelling up” agenda

Government R&D spending in the UK is currently highly concentrated in those parts of the country that are already most prosperous – the Greater South East, comprising London, the Southeast and East of England. In our NESTA paper “The Missing Four Billion, making R&D work for the whole UK”, Tom Forth and I documented this imbalance. For example, London, together with the two subregions containing Oxford and Cambridge, account for 46% of all public and charitable spending on R&D, with 21% of the UK’s population.

A large part of the focus of the government’s “levelling up” agenda should be on the problem of transforming the economies of those parts of the country where productivity lags. Government spending on R&D should contribute to this, by supporting private sector innovation and skills. Currently, though, the UK’s R&D imbalances work in the opposite direction.

The Comprehensive Spending Review makes a welcome recognition of this issue, stating in paragraph 3.7:

“SR21 invests a record £20 billion by 2024-25 in Research and Development (R&D). The government will ensure that an increased share of the record increase in government spending on R&D over the SR21 period is invested outside the Greater South East, and will set out the plan for doing this in the forthcoming Levelling Up White Paper. The investment will build on the support provided throughout the UK via current programmes such as the Strength in Places Fund and the Catapult network.”

This is an important commitment. It is the substantial real increase in R&D spending that gives us the opportunity, for the first time for many decades, to have the prospect of raising the R&D intensity of the UK’s economically lagging cities and regions without compromising the existing scientific excellence found in places like Oxford and Cambridge.

How much money should be involved? The £20 billion R&D spend planned for 2024/25 represents a £5 billion increase from the current year; the business-as-usual split would suggest a bit more than half of that increase would go to the Greater South East. So, to ensure that an “increased share” goes outside the greater South East, we should be aiming for an uplift of order £3.5 – £4 billion. As the title of our paper suggests, that is a sum on a scale that could make a material difference.

How should the money be spent in a way that delivers the outcomes we want – more productive regional economies, leading to more prosperous and flourishing communities? Paragraph 3.7 mentions two existing programmes – “Strength in Places” and the Catapult Centres. I think these are good programmes that can be built on, but they are not likely to be sufficient in scale by themselves, so more will be needed. Here are some concrete suggestions:

  • Double the size of the Strength in Places fund, and streamline the administrative processes surrounding it.
  • Expand the existing Catapult Network, creating new centres to support innovation in a wider range of industries and sectors across the country, stimulating more demand from industry across the whole country to participate in an expanded range of Innovate UK programmes.
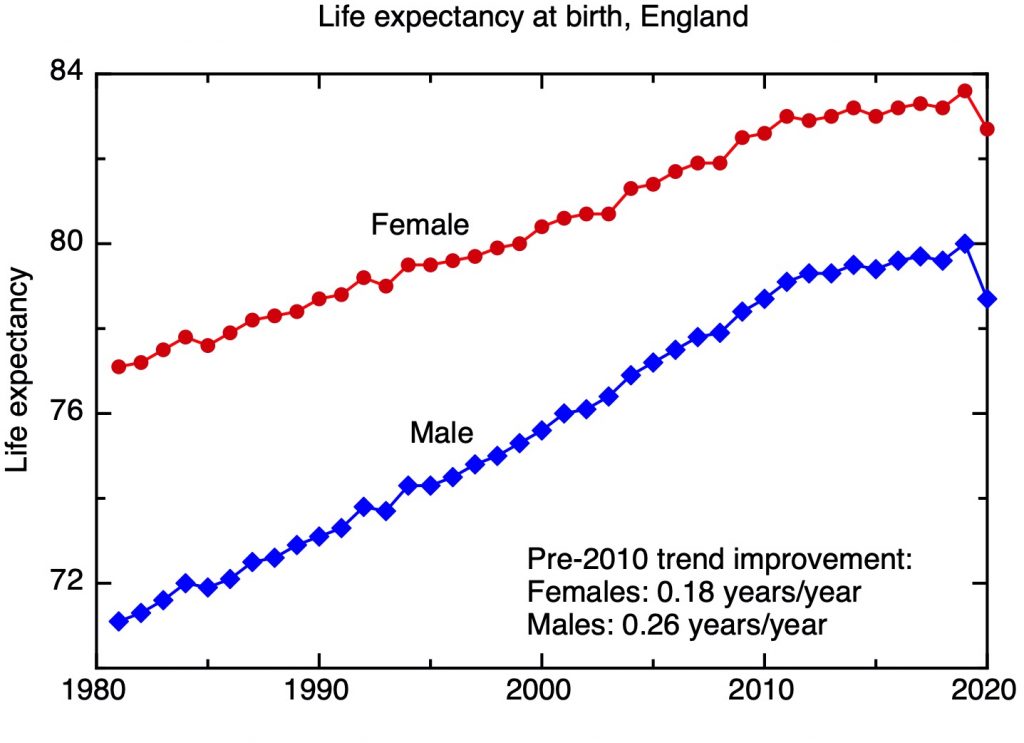
  • Earmark the entire uplift in the budget of the National Institute of Health Research to be spent outside the Greater South East, with a single focus on reducing the shocking health inequalities between and within regions of the UK.
  • Ensure that the majority of R&D in support of the Net Zero goal takes place outside the Greater Southeast, supporting the development of productive new industries, for example in hydrogen for decarbonising heavy industry, new nuclear power, carbon capture and storage including direct air capture, development of zero-carbon fuels (e.g. e-fuels) for aviation and shipping, and large scale retrofitting of housing and adaption of new build to zero-carbon standards.
  • Use the uplift in R&D in support of defense and the security services – particularly in artificial intelligence and cybersecurity – to nucleate new digital clusters outside the Greater Southeast.
  • We await further details of the government’s proposals in the forthcoming Levelling Up White Paper. In my view, to achieve the government’s goals, we need to reconsider how decisions are made about R&D spending. Good decisions about the kinds of R&D support that work with the grain of existing local and regional economies need local knowledge of the kind that it is unreasonable to expect policy makers based centrally in Whitehall to have.

    Instead, I hope that the Levelling Up White Paper will create structures through which policy makers in central government and its agencies can work with more local and regional organisations in “Innovation Deals”, to co-create and research priorities that are both appropriate for specific places but also contribute in a joined-up way to national priorities. The local partners in these Innovation Deals should be credible, representative organisations bringing together the private sector, local government (e.g. Mayoral Combined Authorities in our big cities), and public sector R&D organisations, including universities.

    What should government R&D be for?

    By focusing too much on whether the government is going to hit or miss its target of £22 billion R&D spending, we forget that the purpose of R&D spending isn’t just to hit a numerical target, but to support some wider goals, to help solve some of the deeper problems that the country faces. I’d list those goals, not necessarily in order of importance, as follows.

  • Restoring productivity growth to the economy as a whole. Since the global financial crisis, productivity growth has dramatically slowed down, leading in turn to stagnant wages and living standards, and to a difficult fiscal situation that produces pressure on public services.
  • Raising the productivity of the UK’s economically lagging cities and regions. In particular, the UK’s second tier cities underperform relative to their counterparts in Europe, and their economies are not strong enough to drive the economically failing de-industrialised towns in their peripheries.
  • The innovation needed to make the wrenching economic transition to a net-zero energy economy by 2050 economically affordable and politically viable.
  • The health-related research that’s needed to underpin a health and social care system that is affordable, humane and sustainable for an ageing population, learning the lessons from a pandemic which is not likely to be the last one.
  • The research needed for our defence and security services to maintain a technological edge, to keep the nation secure in an increasingly hostile world.
  • I think the settlement of the science budget in the Comprehensive Spending Review takes us in the right direction. It’s a good settlement for the science community, but they aren’t its ultimate beneficiaries, and to achieve these goals we will need to do some things differently. In the words of Anthony Finkelstein, “We – ‘the science community’ – have done a deal. The sustained increase in R&D funding we have secured over several budgets is firmly based on a reciprocal promise: that we will deliver for UK prosperity.”

    Edited 8 November, to correct graphs 1 & 2, which originally had 2027 rather than 2026 for the new target date for £22 bn

    With the Commons Science Select Committee on “The role of technology, research and innovation in the COVID-19 recovery”

    The House of Commons Select Committee on Science and technology visited Manchester on 21st September, and I was asked to give oral evidence, with others, to its inquiry on “The role of technology, research and innovation in the COVID-19 recovery”. The full, verbatim, transcript is available here; here are a few highlights.

    My opening statement

    Chair: Perhaps I can start with a question to Professor Jones. Everybody around the world associates Manchester with technology over the ages, but if we look at the figures, the level of research and development spending investment, in the north-west at least, is below the national average. Give us a feeling for why that might be and whether that is inevitable and reflects things that we cannot help or what we should be doing about it, bearing in mind that we will be going into a bit more detail later in the session.

    Professor Jones: On the question of the concentration of research, this is something that has happened over quite a long time. The figure that I have in my mind is that 46% of all public and charitable R&D happens in London and the two regions that contain Oxford and Cambridge. There is no doubt—it is not just a question of Manchester—that the distribution of public research money across the country is very uneven.

    That has been a consequence partly of deliberate decisions—there has been a time when the idea has been, particularly when funding seemed tight, that it would be better to concentrate money in a few centres—but when it is given out competitively without regard for place, there is a natural tendency for concentration. Good people go to where existing facilities are. That allows you to write stronger bids and in that case there is a self-reinforcing element. That process is played out over quite a long time. It has got us to the situation of quite extreme imbalance.

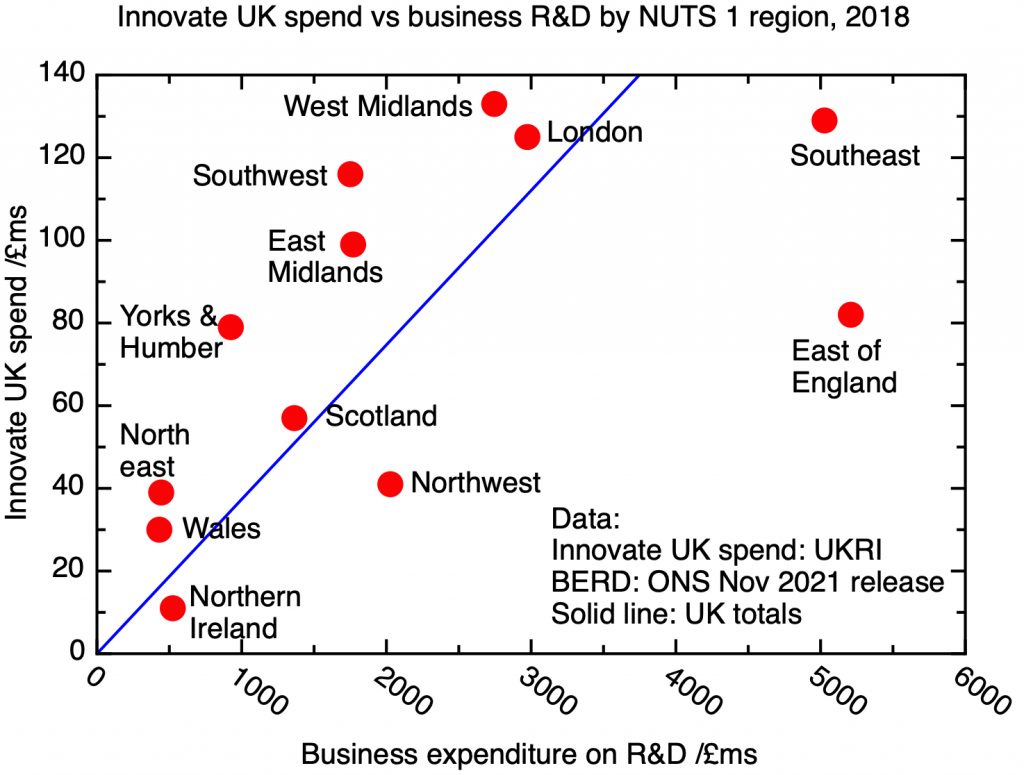
    I have been talking there about public R&D. It is very important to think about private R&D as well. There is an interesting disparity between where the private sector invests its R&D money and where the public sector does. One finds places like Cambridge, which are remarkable places, where there is a lot of public sector R&D but then the private sector piles in with a great deal of money behind that. Those are great places that the country should be proud of and encourage. Particularly in the north-west, in common with the east midlands and west midlands, too, the private sector is investing quite a lot in R&D, but the public sector is not following those market signals and, in a sense, exploiting what in many ways are innovation economies that could be made much stronger by backing that up with more public funding.

    On excellence and places

    Graham Stringer: This is my final question on this section. The drift of great scientists to the golden triangle has been going on for a long time. Rutherford discovered the nucleus of the atom a quarter of a mile down the road in what is now a committee room, sadly. Rutherford left Manchester and went to the Cavendish afterwards. Do you think it is possible to stop that drift, because money also follows great scientists as well as institutions? The University of Manchester is a world-class university, but do you think it is possible to stop that drift and get University of Manchester, and some of the other great northern universities, up the pecking order to be in the same region as Imperial, Oxford and Cambridge?

    Professor Jones: Yes, there is scope to do that. You mentioned Rutherford. I used to teach in the Cavendish myself, so I have made the reverse journey.

    The point that is important, if we talk about excellence, is that people loosely say Cambridge is excellent. Cambridge is not excellent. Cambridge is a place that has lots of excellent people. The thing that defines excellence is people, and people will respond to facilities. If we create excellent facilities, we create an excellent environment, then excellent people from all over the world will want to come to those places.

    It is possible to be too deterministic about this. One can create the environment that will attract excellent people from all over the world. That is what we ought to aim to do if we want to spread out scientific excellence across the country.

    Graham Stringer: To simplify: the answer is for investment in absolutely world-class kit in universities away from the golden triangle?

    Professor Jones: It is world-class kit, but it is also the wider intellectual climate: excellent colleagues. People like to go where there are excellent colleagues, excellent students. That is the package that you need.

    On “levelling-up” and R&D spending

    Chair: As you say, clearly it would not be a step towards achieving the status of a science superpower if we were reducing core budget, so the opportunity to have a greater quantity of regional investment comes from an increase in the budget. Is it fair to infer logically from that that, of the increase, you would expect a higher proportion to be regionally distributed than the current snapshot of the budget?

    Professor Jones: Yes, absolutely. If we take the Government at their word about saying that there are going to be genuine increases in R&D, this does give us a unique opportunity because we have had quite flat research budgets for a couple of decades. Up to now we have always been faced with that problem: do you really want to take money away from the excellence of Oxford and Cambridge to rebalance? That is a difficult issue because, as I said in my opening remarks, Cambridge is a fantastic asset to the UK’s economy. But if we do have this opportunity to see rising budgets, if we are going from £14.9 billion to £22 billion—that is £7 billion of rise that has been pencilled in—it would be very disappointing if a reasonable fraction of that was not ring-fenced to start to address these imbalances, specifically with the aim of boosting the economy of those places with productivity that is too low needs to be raised.

    I think that tying it very directly to the Government’s goals of levelling up, increasing the productivity of economically lagging regions as well as their other very important goals of net zero, would be entirely reasonable.

    Chair: That is literally and specifically what you are describing, is it not—levelling up, in the sense that you have said you do not want to take down the budgets of existing institutions, you want to increase the others? That is levelling up.

    Professor Jones: Indeed.

    On the £22 billion target for UK government R&D

    As the pandemic moves to a new phase, it’s natural to assume that the Prime Minister would want to make progress on the other agendas that he might hope would define his tenure. Prominent in these has been his emphasis on the need to restore the UK’s place as a “Science Superpower” – for example, in his 15 July speech he said: “We are turning this country into a science superpower, doubling public investment in R and D to £22 billion and we want to use that lead to trigger more private sector investment and to level up across the country”, a theme he’d set out in detail in a 21 June article in the Daily Telegraph. The theme of boosting science and innovation is also crucial to the government’s other key priorities, “levelling up” by reducing the gross geographical disparities in economic performance and health outcomes across the UK, delivering on the 2050 “Net Zero” target, and securing a strategic advantage in defence and security through science and technology in an increasingly uncertain world.

    And yet, the public finances are in disarray following the huge increase in borrowing needed to get through the pandemic, the economy has suffered serious and lasting damage, and the talk is of a very tight spending settlement in the upcoming comprehensive spending review, given the need for further spending in the NHS and education systems to start to repair ongoing costs and the lasting aftermath of the pandemic. How robust will the Prime Minister’s commitment to science and innovation be in the face of many other pressing demands on public spending, and a Treasury seeking to bring the public finances back towards more normal levels of borrowing? The government is committed to two R&D numbers – a long term target, of increasing the total R&D intensity – public and private – of the UK economy to 2.4% by 2027. Another shorter term promise – of increasing government spending on research and development to £22 billion by 2024 – was introduced in the 2020 budget, and has recently been reasserted by the Prime Minister – though without a date attached.

    Some people might worry that the government could seek to resolve this tension by creative accounting, finding a way to argue that the letter of the commitments has been met, while failing to fulfil their spirit. It would be possible to bend the figures to do this, but this would be a bad idea that would put in jeopardy the government’s larger stated intentions. In particular, anything that involves a reclassification of existing expenditure rather than an overall increase, will do nothing to help the overall goal of making the UK’s economy more R&D intensive, and achieving the overall 2.4% R&D intensity target.

    To begin with, let’s look at the current situation. A breakdown of government spending in real terms shows that we have seen real increases, although it will not have felt that way to university-based scientists depending on research council and block grant funding. The increase the plot shows on the introduction of UKRI partly reflects an accounting artefact, by which spending in InnovateUK has been shifted out of the BEIS department budget into UKRI, but in addition to this there was a genuine uplift through programmes such as the “Industrial Strategy Challenge Fund”. These figures also include a notional sum for the UK’s contribution to the EU research programmes. In the future, assuming the question of the UK’s association with the Horizon programme is finally resolved satisfactorily, contributions to the EU research programmes will continue to be included in total R&D investment, as they should be, in my opinion. The uplift we’ve seen in the current year includes a contribution for EU programmes, as well as some substantial increases in R&D funding by government departments, especially the Ministry of Defence (overall departmental spending outside UKRI is dominated by the MoD and the Department of Health and Social Care).

    Total government spending on R&D from 2008 to 2019 as recorded by ONS, in real terms. 2021 is announced commitment. UKRI figure excludes Research England, but includes InnovateUK funding, previously recorded as department spending in BEIS (here included in “rest of government”). Research England is included in “HE research block grants”, which also includes university research funding from Devolved Administrations and, pre-2018, HEFCE. Data: Research and development expenditure by the UK government: 2019. ONS April 2021

    To summarise, it is true to say that government spending is higher now in real terms than it has been for more than a decade. But this still doesn’t look like a trajectory heading towards a doubling, and £22 billion looks a long way away.

    Of course, these are figures that are corrected for inflation; we will see a more flattering picture if we neglect this. And there might be some flexibility over the timescale for achieving the £22 billion target. My next plot shows the overall trajectory of government spending on R&D, in current money, without an inflation correction. The red line indicates the path required to achieve the £22 billion by the original date, 2024. This would require a substantial increase in the rate of the growth we have seen in recent years. But one might argue that the pandemic has forced a slippage of the timescale, which might be aligned with the 2027 target for achieving the overall 2.4% of GDP R&D intensity target. This does look achievable with current rate of nominal growth – and of course the pulse of inflation we’re likely to see now will make achieving £22 billion even easier (albeit at the cost of less real research output).

    Total government spending on R&D from 2008 to 2019 as recorded by ONS, in current money (non-inflation corrected) terms. 2021 is announced commitment. Data: Research and development expenditure by the UK government: 2019. ONS April 2021

    But there is another possibility for modifying the figures that may well have occurred to someone on Horse Guards Road. That would be to include the cost of R&D tax credits. These are subsidies offered by the government for research carried out in business, that according to circumstances can be taken as a reduction in corporation tax liability or a direct cash payment from government (the latter being particularly important for early stage start-ups that aren’t yet generating a profit). This, then, is another cost incurred by the government related to R&D, representing not direct R&D spending, but lost tax income and outgoings. It’s perhaps not widely enough appreciated how much more generous this scheme has become over the last decade, and there is a separate discussion to be had about how effective these schemes are, and the value for money of this very substantial cost to government.

    My next plot shows the effect of adding on the cost of R&D tax credits to direct government spending on R&D. The effect is really substantial – and would seem to put the £22 billion target within reach without the government having to spend any more money on R and D.

    Government spending on R&D from 2008 to 2019, as above, together with the cost of R&D tax credits (includes an HMRC estimate for total cost in 2019). The estimate for 2021 combines the committed figure for government R&D with the assumption that the cost of R&D tax credit remains the same in real terms as its 2019 value. All values corrected for inflation and expressed in 2019 £s. Uncorrected for the mismatch between fiscal years, by which R&D tax credit data is collected, and calendar years, for R&D spending.

    We can make the situation look even better by not accounting for inflation. This is illustrated in the next figure.

    Government spending on R&D from 2008 to 2019, as above, together with the cost of R&D tax credits (includes an HMRC estimate for total cost in 2019). The estimate for 2021 combines the committed figure for government R&D with the assumption that the cost of R&D tax credit remains the same in real terms as its 2019 value. All values in nominal current cash terms (uncorrected for inflation). Uncorrected for the mismatch between fiscal years, by which R&D tax credit data is collected, and calendar years for R&D spending.

    This not only gets us very close to £22 billion spending ahead of target, but also might allow one to argue that the Prime Minister’s claim of doubling government investment in R&D had been fulfilled, taking the timescale to be a decade of Conservative-led governments.

    What would be wrong with this? It would actually lock in a real terms erosion of spending on R&D, and would not help deliver the more enduring target, of raising the R&D intensity of the UK economy to 2.4% of GDP by 2027, most recently reasserted in the HM Treasury document “Build back better: Our Plan for Growth”. This target is for combined business and public sector funding – but redefining government R&D spending to include the government’s subsidy of R&D in business simply moves spending from one heading to another, without increasing its total. This would stretch to breaking to breaking point the larger claim, that the government is “turning this country into a science superpower”.

    Currently, while the UK’s science base has many strengths, it is too small for an economy of the size of the UK. If we measure the R&D intensity of the economy in terms of total investment – public and private – as a proportion of GDP, the UK is a long way behind the leaders, as my next plot shows. By R&D intensity, the UK is not a leader, or even an average performer, but in the third rank, between Italy and Czechia. The UK’s science base is a potential source of economic and strategic advantage, but it is currently too small.


    R&D intensity of selected nations by sector of performance, 2018. Data: Eurostat.

    This is widely recognised by policy makers, and is the logic behind the 2.4% R&D intensity target that was in the Conservative manifesto, and has since been frequently reasserted, for example in the Treasury’s “Plan for Growth”. In one sense, this is still not a very demanding target – assuming (unrealistically) that the R&D intensity of other countries remains the same, far from elevating the UK to be one of the leaders, it would leave it just behind Belgium.

    How much would the UK’s R&D spending need to increase to meet the 2.4% R&D intensity target? This, of course, depends on what happens to the denominator – GDP – in the meantime. Based on the OBR’s March estimates, we might expect GDP in 2027 to be around £2.4 trillion, up from £2.22 trillion in 2019, before the effects of the pandemic (both in 2019 £s). So to meet the target, total R&D spending – public and private – would need to be £58 billion.

    This compares to total R&D spending in 2019 of £38.5 billion, split almost exactly 1/3:2/3 between the public and private sectors (this figure includes expenditure associated with the R&D tax credits, but this appears here on the private sector side). So to achieve the 2.4% target, there needs to be a 50% real terms increase in both public and private sector R&D relative to 2019. If the same split between public and private is maintained, we’d need £19.4 billion public and £38.8 billion business R&D.

    There are two points to make about this. Firstly, we note that the estimate for the required public R&D is actually lower than the £22 billion government promise. This reflects the fact that the 2.4% target is less demanding than it used to be, since we now think we’ll be poorer in 2027 than we expected in 2019. However, remember that this is a figure in 2019 £s – so in real terms inflation will push up the nominal value. In fact, a very rough estimate based on the OBR’s inflation projections suggest that £22 billion nominal by 2027 as the government’s investment in R&D could be about right. On the other hand, OBR’s March 2021 forecast was quite pessimistic compared to other forecasters. If GDP turns out to recover more fully from the pandemic than the OBR thought, then R&D spending will need to be higher to meet the target – but this will be easier to fund given a larger economy.

    Secondly, note that this split between public and private sector is based on where the research is carried out, not who funds it. So the subsidy provided by the government in the form of R&D tax credits appears on the private sector side of the ledger. Unless the split between public and private dramatically changes over the next few years, then the £22 billion the government needs to put in can’t include the cost of R&D tax credits.

    Targets are important, but they are a means to an end. The Plan for Growth identifies “Innovation” as one of three pillars of growth. A return to economic growth, after a decade of stagnation of productivity growth and living standards, capped by a devastating pandemic, is crucial in itself. But innovation also directly underpins the government’s three main priorities.

    The first of these is the transition to net zero. This requires a wrenching change of the whole material base of our economy; it needs innovation to drive costs down – and to make sure that it is the UK’s economy and the UK’s communities that benefit from the new economic opportunities that this transition will bring.

    The second is “levelling up”, which, to be more than a slogan, should involve a sustained attempt to increase the productivity of the UK’s lagging cities and regions through increasing innovation and skills. This won’t be possible without correcting the imbalance in government R&D investment between the prosperous Greater Southeast and the lagging rest of the country. We shouldn’t put at risk the outstanding innovation economies we do have in places like Cambridge, so this needs to involve new money at a scale that will make a material difference.

    Finally, we need to rethink the UK’s position in the world. Part of this is about making sure the UK remains an attractive destination for inward investment by companies at the global technological frontier, and that the UK’s industries can produce internationally competitive products and services for export. But the world has also got more dangerous, and the modernisation of the UK’s armed forces and security agencies needs to be underpinned by R&D.

    The government will not be able to achieve these goals without a real increase in R&D spending. That does not mean, however, that we should just do more of the same. We need more emphasis on the “development” half of R&D, we need to coordinate the strategic research goals of the government better across different departments, we need to support the development of internationally competitive R&D clusters outside the southeast, all the while sustaining and growing our outstanding discovery science.

    So, could the government game its £22 billion R&D promise, by reclassifying the cost of the R&D tax credit as government investment in R&D and ignoring the effect of inflation? Yes, it could.

    Should it? No, it should not. To do so would put the 2.4% R&D intensity target out of reach. It would seriously undercut the government’s main priorities – net zero, “levelling up” – and keeping the UK secure in a dangerous world. And it would put paid to any pretensions the UK might have of recovering “science superpower” status.

    Instead, I believe there needs to be realism and honesty – both about the difficulty of the post-pandemic fiscal situation, and the need for genuine increases in government spending in R&D if its long term economic and climate goals are to be met. £22 billion is about the right figure to aim for, but if the extraordinary circumstances of the pandemic make it difficult to achieve this on the original timescale, the government should set out a new timescale, with a fully developed timetable outlining how this increase will be achieved in order to deliver the 2027 2.4% R&D intensity target. Early increases should focus on the areas of highest priority – with, perhaps, highest priority of all being given to net zero. Climate change will not wait.

    Bleach and the industrial revolution in textiles

    Sunshine is the best disinfectant, they say – but if you live in Lancashire, you might want to have some bleach as a backup. Sunshine works to bleach clothes and hair too – and before the invention of the family of chlorine based chemicals that are commonly known as bleach, the Lancashire textile industry – like all other textile industries around the world – depended on sunshine to whiten the naturally beige colour of fabrics like cotton and linen. It’s this bright whiteness that has always been prized in fine fabrics, and is a necessary precondition for creating bright colours and patterns through dyeing.

    As the introduction of new machinery to automate spinning and weaving – John Kay’s flying shuttle, the water frame, and Crompton’s spinning mule – hugely increased the potential output of the textile industry, the need to rely on Lancashire’s feeble sunshine to bleach fabrics in complex processes that could take weeks was a significant blockage. The development of chemical bleaches was a response to this; a significant ingredient of the industrial revolution that is perhaps not widely appreciated enough, and an episode that demonstrates the way scientific and industrial developments went hand-in-hand at the beginning of the modern chemical industry.

    It’s not obvious now when one looks at the clothes in 17th and 18th century portraits, with their white dresses, formal shirts and collars, that the brilliant white fabrics that were the marker of their rich and aristocratic subjects were the result of complex and expensive set of processes. Bleaching at the time involved a sequence of repeated steepings in water, boiling in lye, soaping, soaking in buttermilk (and towards the end of this period, dilute sulphuric acid) – together with extensive “grassing” – spreading the fabrics out in the sun in “bleachfields” for periods of weeks. These expensive and time-consuming processes were a huge barrier to the expansion of the textile industry, and it was in response to this barrier that chemical bleaches were developed in the late 18th century.

    The story begins with the important French chemist Claude-Louis Berthollet, who in 1785 discovered and characterised the gas we now know as chlorine, synthesising it through the reduction of hydrochloric acid by manganese dioxide. His discovery of what he called “dephlogisticated muriatic acid” [1] was published in France, but news of it quickly reached England, not least through direct communication by Berthollet to the Royal Society in London. Only a year later, the industrialist Matthew Boulton and his engineer partner James Watt were visiting Paris; they met Berthollet, and were able to see his initial experiments showing the effect chlorine had on colours, either using the gas directly or in solution in water. The potential of the new material to transform the textiles industry was obvious both to Berthollet and his visitors from England.

    James Watt had a particular reason to be interested in the process – his father-in-law, James McGrigor – owned a bleaching works in Glasgow. Watt had soon developed an improvement to the process for making chlorine; instead of using hydrochloric acid, he used sulphuric acid and salt, exploiting the new availability and relative low cost of sulphuric acid since the development of the lead chamber process in 1746 by John Roebuck and Samuel Garbett. In 1787 he sent a bottle of his newly developed bleach to his father-in-law, and arranged for a ton of manganese dioxide [2] to be sent from Bristol to Glasgow to begin large scale experiments. Work was needed to develop a practical regime for bleaching different fabrics, to find methods to assay the bleaching power of the solutions, and to develop the apparatus of this early chemical engineering – what to make the vessels out of, how to handle the fabric. By the end of the year, with the help of Watt, McGrigor had successfully scaled up the process to bleach 1500 yards of linen.

    Meanwhile, two Frenchmen – Antoine Bourboulon de Boneuil and Matthew Vallet – had arrived in Lancashire from Paris, where they had developed a proprietary bleaching solution – “Lessive de Javelle” – which built on Berthollet’s work (without his involvement or approval). This probably used the method of dissolving the chlorine in a solution of sodium hydroxide, which absorbs more of the gas than pure water. This produces a solution of sodium hypochlorite, like the everyday “thin bleach” of today’s supermarket shelves. In 1788 Bourboulon petitioned Parliament to grant them an exclusive 28 year license for the process (a longer period than a regular patent). This caused some controversy and was strongly opposed by the Lancashire bleachers, but placed James Watt in an awkward position. Naturally he opposed the proposal, but didn’t want to do this too publicly, as his own, very broad, patent (with Matthew Boulton) for the steam engine had been extended by Act of Parliament in 1775, leading to lengthy litigation. Nonetheless, after the intervention of Berthollet himself and the growing awareness of the new science of chemical bleaching in the industrial community, Bourboulon only succeeded in obtaining patents for relatively restricted aspects of his process, that were easily evaded by other operations.

    Claude-Louis Berthollet’s position in this was important, as his priority in discovering the basic principles of chlorine bleaching was universally accepted. But Berthollet was an exponent of the principles of what would now be called “open science” and consciously repudiated any opportunities to profit from his inventions – as he wrote to James Watt, “I am very conscious of the interest that you take in a project which could be advantageous to me; but to return to my character, I have entirely renounced involvement in commercial enterprises. When one loves science, one has little need of fortune, and it is so easy to expose one’s happiness by compromising one’s peace of mind and embarrassing oneself”. Watt was clearly frustrated by Berthollet’s tendency to publish the results of his experiments, which often included rediscovering the improvements that Watt himself had made.

    But by this stage, any secrets were out, and other Manchester industrialists, together with a new breed of what might be called consulting chemists, who kept up with the latest scientific developments in France and England, were experimenting and developing the processes further. Their goals included driving down the cost, increasing the scale of operations, and particularly improving their reliability – it was all too easy to ruin a batch of cloth by exposing it too long or using too strong a bleaching agent, or to poison the workmen with a release of chlorine gas. In fact, one shudders to think about the health and safety record and environmental impact of these early developments. Even by 1795, it still wasn’t always clear that the new methods were cheaper than the old ones, particularly for case of linen, which was significantly more difficult to bleach than cotton. Despite the early introduction of “Lessive de Javelle”, the stability of bleaching fluids was a problem, and most bleachers preferred to brew up their own as needed, guided by lots of practical experience and chemical knowledge.

    Bleaching probably could never be made entirely routine, but the next big breakthrough was to create a stable bleaching powder which could be traded, stored and transported, and could be incorporated in a standardised process. Some success had been had by absorbing chlorine in lime. The definitive process to make “bleaching powder” by absorbing chlorine gas in damp slaked lime (calcium hydroxide), to produce a mixture of calcium hypochlorite and calcium chloride, was probably developed by the Scottish chemist Charles Macintosh (more famous as the inventor of the eponymous raincoat). The benefits of this discovery, though, went to Macintosh’s not wholly trustworthy business partner, Charles Tennant, who patented the material in 1799.

    What are the lessons we can learn from this episode? It underpins the importance of industrial chemistry, an aspect of the industrial revolution that perhaps is underplayed. It’s a story in which frontier science was being developed at the same time as its industrial applications, with industrialists understanding the importance of being linked in with international networks of scientists, and organisations like the Manchester Literary and Philosophical Society operating as important institutions for diffusing the latest scientific results. It exposes the tensions we still see between open science and the protection of intellectual property, and the questions of who materially benefits from scientific advances.

    As the nineteenth century, the textile industry continued to be a major driver of industrial chemistry – the late 18th century saw the introduction of the Leblanc process for making soda-ash, and the nineteenth century saw the massive impact of artificial dyes. These developments influence the industrial geography of England’s northwest to this day.

    [1] When Berthollet discovered chlorine, it was in the heyday of the phlogiston theory, so, not appreciating that what he’d discovered was a new gaseous element, he called it “dephlogisticated muriatic acid” (muriatic acid being an old name for hydrochloric acid). As Lavoisier’s oxygen theory became more widely accepted, the gas became known as “oxymuriatic acid”. It was only in 1810 that Humphry Davy showed that chorine contains no oxygen, and is in fact an element in its own right. Phlogiston has a bad reputation as a dubious pre-scientific relic, but it was a rational way of beginning to think about oxidation and reduction, and the nature of heat, giving a helpful guide to experiments – including the ones that eventually showed that the concept was unsustainable.

    [2] It’s interesting to ask why there was an existing trade in manganese dioxide. This mineral had been used since prehistory as a black pigment, and is unusual as a strong oxidising agent that is widely found in nature. In Derbyshire it occurs as an impure form known to miners as “wad”; when mixed with linseed oil (as you would do to make a paint) it occasionally has the alarming property of spontaneously combusting. This was recorded in a 1783 communication to the Royal Society by the renowned potter Josiah Wedgwood, who ascribed the discovery to a Derby painter called Mr Bassano, and reported seeing experiments showing this property at the house of the President of the Royal Society, Sir Joseph Banks. Spontaneous combustion isn’t a great asset for a paint, but at lower loadings of manganese dioxide a less dramatic acceleration of the oxidation of linseed oil is useful in making varnish harden more quickly, and it was apparently this property that led to its widespread use in paints and varnishes, particularly for ships in the great expansion of the British Navy at the time. More pure deposits of manganese dioxide were found in Devon, and subsequently in North Wales, as the bleach industry increased demand for the mineral further. The material gained even more importance following Robert Mushet’s work on iron-manganese alloys – it was the incorporation of small amounts of manganese that made the Bessemer process for the first truly mass produced steel viable.

    [3] Sources: this account relies heavily on “Science and Technology in the Industrial Revolution”, by A. E. Musson and E. Robinson. For wad, “Derbyshire Wad and Umber”, by T.D. Ford, Mining History 14 p39.

    Edited 23/8/21 to make clear that Bourboulon’s petition to Parliament was for a longer period of exclusivity than a standard patent. My thanks to Anton Howes for pointing this out.

    Reflections on the UK’s new Innovation Strategy

    The UK published an Innovation Strategy last week; rather than a complete summary and review, here are a few of my reflections on it. It’s a valuable and helpful document, though I don’t think it’s really a strategy yet, if we expect a strategy to give a clear sense of a destination, a set of plans to get there and some metrics by which to measure progress. Instead, it’s another milestone in a gradual reshaping of the UK’s science landscape, following last year’s R&D Roadmap, and the replacement of the previous administration’s Industrial Strategy – led by the Department of Business, Energy and Industrial Strategy – by a Treasury driven “Plan for Growth”.

    The rhetoric of the current government places high hopes on science as a big part of the UK’s future – a recent newspaper article by the Prime Minister promised that “We want the UK to regain its status as a science superpower, and in so doing to level up.” There is a pride in the achievements of UK science, not least in the recent Oxford Covid vaccine. And yet there is a sense of potential not fully delivered. Part of this is down to investment – or the lack of it: as the PM correctly noted: “this country has failed for decades to invest enough in scientific research, and that strategic error has been compounded by the decisions of the UK private sector.”

    Last week’s strategy focused, not on fundamental science, but on innovation. As the old saying goes, “Research is the process of turning money into ideas, innovation is turning ideas into money” – and, it should be added, other desirable outcomes for the nation and society – the necessary transition to zero carbon energy, better health outcomes, and the security of the realm in a world that feels less predictable. But the strategy acknowledges that this process hasn’t been working – we’ve seen a decline in productivity growth that’s unprecedented in living memory.

    This isn’t just a UK problem – the document refers to an apparent international slowing of innovation in pharmaceuticals and semiconductors. But the problem is worse in the UK than in comparator nations, and the strategy doesn’t shy away from connecting that with the UK’s low R&D intensity, both public and private: “One key marker of this in the UK is our decline in the rate of growth in R&D spending – both public and private. In the UK, R&D investment declined steadily between 1990 and 2004, from 1.7% to 1.5% of GDP, then gradually returned to be 1.7% in 2018. This has been constantly below the 2.2% OECD average over that period.”

    One major aspiration that the government is consistent about is the target to increase total UK investment in R&D (public and private) to reach 2.4% of GDP by 2027, from its current value of about 1.7%. As part of this there is a commitment to increase public spending from £14.9 bn this year to £22 bn – by a date that’s not specified in the Innovation Strategy. An increase of this scale should prompt one to ask whether the institutional landscape where research is done is appropriate, and the document announces a new review of that landscape.

    Currently the UK’s public research infrastructure is dominated by universities to a degree that is unusual amongst comparator nations. I’m glad to see that the Innovation Strategy doesn’t indulge in what seems to be a widespread urge in other parts of government to denigrate the contribution of HE to the UK’s economy, noting that “in recent years, UK universities have become more effective at attracting investment and bringing ideas to market. Their performance is now, in many respects, competitive with the USA in terms of patents, spinouts, income from IP and proportion of industrial research.” But it is appropriate to ask whether other types of research institution, with different incentive structures and funding arrangements, might be needed in addition to – and to make the most of – the UK’s academic research base.

    But there are a couple of fundamentally different types of non-university research institutions. On the one hand, there are institutions devoted to pure science, where investigators have maximum freedom to pursue their own research agendas. Germany’s Max Planck Institutes offer one model, while the Howard Hughes Medical Institute’s Janelia Research Campus, in the USA, has some high profile admirers in UK policy circles. On the other hand, there are mission-oriented institutes devoted to applied research, like the Fraunhofer Institutes in Germany, the Industrial Technology Research Institute in Taiwan, and IMEC (the Interuniversity Microelectronics Centre) in Belgium. The UK has seen a certain amount of institutional evolution in the last decade already, with the establishment of the Turing Institute, the Crick Institute, the Henry Royce Institute, the Rosalind Franklin Institute, the network of Catapult Centres, to name a few. It’s certainly timely to look across the landscape as it is now to see the extent to which these institutions’ missions and the way they fit together in a wider system have crystallised, as well as to ask whether the system as a whole is delivering the outcomes we want as a society.

    There is one inescapable factor about the institutional landscape we have now that is seriously underplayed – that is that what we have now is a function of the wider political and economic landscape – and the way that’s changed over the decades. For example, there’s a case study in the Innovation Strategy of Bell Laboratories in the USA. This was certainly a hothouse of innovation in its heyday, from the 1940’s to the 1980’s – but that reflected its unique position, as a private sector laboratory that was sustained by the monopoly rents of its parent. But that changed with the break-up of the Bell System in the 1980’s, itself a function of the deregulatory turn in US politics at the time, and the institution is now a shadow of its former self. Likewise, it’s impossible to understand the drastic scaling back of government research laboratories in the UK in the 1990’s without appreciating the dramatic policy shifts of governments in the 80’s and 90’s. A nation’s innovation landscape reflects wider trends in political economy, and that needs to be understood better and the implications made more explicit.

    With the Innovation Strategy was published a “R&D People and Culture Strategy”. This contains lots of aspirations that few would disagree with, but not much in the way of concrete measures to fix things. To connect this with the previous discussion, I would have liked to have seen much more discussion of the connection between the institutional arrangements we have for research, the incentive structure produced by those arrangements, and the culture that emerges. It’s a reasonable point to complain that people don’t move as easily from industry to academia and back as they used too, but it needs to be recognised that this is because the two have drifted apart; with only a few exceptions, the short term focus of industry – and the high pressure to publish on academics – makes this mobility more difficult. From this perspective, one question we should ask about our institutional landscape, is whether it is the right one to allow the people in the system to flourish and fulfil their potential?

    We shouldn’t just ask in what kind of institutions research is done, but also where those are institutions situated geographically. The document contains a section on “Levelling Up and innovation across the UK”, reasserting as a goal that “we need to ensure more places in the UK host world-leading and globally connected innovation clusters, creating more jobs, growth and productivity in those areas.” In the context of the commitment to increase the R&D intensity of the economy, “we are reviewing how we can increase the proportion of total R&D investment, public and private, outside London, the South East, and East of England.”

    The big news here, though, is that the promised “R&D and Place Strategy” has been postponed and rolled into the forthcoming “Levelling Up” White Paper, expected in the autumn. If this does take the opportunity of considering in a holistic way how investments in transport, R&D, skills and business support can be brought together to bring about material changes in the productivity of cities and regions that currently underperform, that is not a bad thing. I was a member of the advisory group for the R&D and Place strategy, so I won’t dwell further on this issue here, beyond saying that I recognise many of the issues and policy proposals which that body has discussed, so I await the final “Levelling Up” White Paper with interest.

    A strategy does imply some prioritisation, and there are a number of different ways in which one might define priorities. The Coalition Government defined 8 Great Technologies; the 2017 Industrial Strategy was built around “Grand Challenges” and “Sector Deals” covering industrial sectors such as Automotive and Aerospace. The current Innovation Strategy introduces seven “technology families” and a new “Innovation Missions Programme”.

    It’s interesting to compare the new “seven technology families” with the old “eight great technologies”. For some the carry over is fairly direct, albeit with some wording changes reflecting shifting fashions – robotics and autonomous systems becomes robotics and smart machines, energy and its storage becomes energy and environment technologies, advanced materials and nanotechnology becomes advanced materials and manufacturing, synthetic biology becomes engineering biology. At least two of the original 8 Great Technologies always looked more like industry sectors than technologies – satellites and commercial applications of space, and agri-science. Big data and energy-efficient computing has evolved into AI, digital and advanced computing, reflecting a genuine change in the technology landscape. Regenerative medicine looks like it’s out of favour, replaced in the biomedical area by bioinformatics and genomics. Quantum technology became appended to the “8 great” a year or two later, and this is now expanded to electronics, photonics and quantum.

    Interesting thought the shifts in emphasis may be, the key issue is the degree to which these high level priorities are translated into different outcomes in institutions and funding programmes. How, for example, are these priority technology families reflected in advisory structures at the level of UKRI and the research councils? And, most uncomfortable of all, a decision to emphasise some technology families must imply, if it has any real force, a corresponding decision to de-emphasise some others.

    One suspects that organisation through industrial sectors is out of favour in the new world where HM Treasury is in the driving seat; for HMT a focus on sectors is associated with incumbency bias, with newer fast-growing industries systematically under-represented, and producer capture of relevant government departments and agencies, leading to a degree of policy attention that reflects a sector’s lobbying effectiveness rather than its importance to the economy.

    Despite this colder new environment, the ever opportunistic biomedical establishment has managed to rebrand their sector deal as a “Life Sciences Vision”. The sector lens remains important, though, because industrial sectors do face their own individual issues, all the more so at a time of rapid change. Successfully negotiating the transition to electric vehicles represents an existential challenge to the automotive sector, while for the persistently undervalued chemicals sector, withdrawal from the EU regulatory framework – REACH – threatens substantial extra costs and frictions, while the transition to net zero presents both a challenge for this energy intensive industry, and a huge set of new potential markets as the supply chain for new clean-tech industries like batteries is developed.

    One very salutary clarification has emerged as a side-effect of the pandemic. The vaccination programme can be held up as a successful exemplar of an “innovation mission”. This emphasises that a “mission” shouldn’t just be a vague aspiration, but a specific engineering project with a product at the end of it – with a matching social infrastructure developed to ensure that the technology is implemented to deliver the desired societal outcome. Thought of this way, a mission can’t just be about discovery science – it may need the development of new manufacturing capacity, new ICT systems, repurposing of existing infrastructures. Above all, a mission needs to be executed with speed, decisiveness, and a willingness to spend money in more than homeopathic quantities, characteristics that aren’t strongly associated with recent UK administrations.

    What further innovation missions can we expect? It isn’t characterised in these terms, but the project to build a prototype power fusion reactor – the “Spherical Tokamak for Energy Production” – could be thought as another one. By no means guaranteed to succeed, it would be a significant development if it did work, and in the meantime it probably will support the spinning out of a number of potentially important technologies for other applications, such as new materials for extreme environments, and further developments in robotics.

    Who will define future “innovation missions”? The answer seems to be the new National Science and Technology Council, to be chaired by the Prime Minister and run by the government’s Chief Scientific Advisor, Sir Patrick Vallance, given an expanded role and an extra job title – National Technology Adviser. In the words of the Prime Minister, “It will be the job of the new National Science and Technology Council to signal the challenges – perhaps even to specify the breakthroughs required – and we hope that science, both public and commercial, will respond.”

    But here there’s a lot to fill in terms of the mechanisms of how this will work. How will the NSTC make its decisions – who will be informing those discussions? And how will those decisions be transmitted to the wider innovation ecosystem – government departments and their delivery agencies like UKRI, and its component research councils and innovation agency InnovateUK? There is a new system emerging here, but the way it will be wired is as yet far from clear.

    Fighting Climate Change with Food Science

    The false claim that US President Biden’s Climate Change Plan would lead to hamburger rationing has provided a predictably useful attack line for his opponents. But underlying this further manifestation of the polarisation of US politics, there is a real issue – producing the food we eat does produce substantial greenhouse gas emissions, and a disproportionate amount of these emissions come from eating the meat of ruminants like cattle and sheep.

    According to a recent study, US emissions from the food system amount to 5 kg a person a day, and 47% of this comes from red meat. Halving the consumption of animal products by would reduce the USA’s greenhouse gas emissions by about 200 million tonnes of CO2 equivalent, a bit more than 3% of the total value. In the UK, the official Climate Change Committee recommends that red meat consumption should fall by 20% by 2050, as part of the trajectory towards net zero greenhouse gas emissions by 2050, with a 50% decrease necessary if progress isn’t fast enough in other areas. At the upper end of the range possibilities, a complete global adoption of completely animal-free – vegan – diets has been estimated to reduce total global greenhouse gas emissions by 14%.

    The political reaction to the false story about Biden’s climate change plan illustrates why a global adoption of veganism isn’t likely to happen any time soon, whatever its climate and other advantages might be. But we should be trying to reduce meat consumption, and it’s worth asking whether the development of better meat substitutes might be part of the solution. We are already seeing “plant-based” burgers in the supermarkets and fast food outlets, while more futuristically there is excitement about using tissue culture techniques to produce in vitro, artificial or lab-grown meat. Is it possible that we can use technology to keep the pleasure of eating meat while avoiding its downsides?

    I think that simulated meat has huge potential – but that this is more likely to come from the evolution of the currently relatively low-tech meat substitutes rather than the development of complex tissue engineering approaches to cultured meat [1]. As always, economics is going to determine the difference between what’s possible in principle and what is actually likely to happen. But I wonder whether relatively small investments in the food science of making meat substitutes could yield real dividends.

    Why is eating meat important to people? It’s worth distinguishing three reasons. Firstly, meat does provide an excellent source of nutrients (though with potential adverse health effects if eaten to excess). Secondly, It’s a source of sensual pleasure, with a huge accumulated store of knowledge and technique about how to process and cook it to produce the most delicious results. Finally, eating meat is freighted with cultural, religious and historical significance. What kind of meat one’s community eats (or indeed, if it it eats meat at all), when families eat or don’t eat particular meats, all of these have deep historical roots. In many societies access to abundant meat is a potent signifier of prosperity and success, both at the personal and national level. It’s these factors that make calls for people to change their diets so political sensitive to this day.

    So how is it realistic to imagine replacing meat with a synthetic substitute? The first issue is easy – replacing meat with foods of plant origin of equivalent nutritional quality is straightforward. The third issue is much harder – cultural change is difficult, and some obvious ways of eliminating meat run into cultural problems. A well-known vegetarian cookbook of my youth was called “Not just a load of old lentils” – this was a telling, but not entirely successful attempt to counteract an unhelpful stereotype head-on. So perhaps the focus should be on the second issue. If we can produce convincing simulations of meat that satisfy the sensual aspects and fit into the overall cultural preconceptions of what a “proper” meal looks like – in the USA or the UK, burger and fries, or a roast rib of beef – maybe we can meet the cultural issue halfway.

    So what is meat, and how can we reproduce it? Lean meat consists of about 75% water, 20% protein and 3% fat. If it was just a question of reproducing the components, synthetic meat would be easy. An appropriate mixture of, say, wheat protein and pea protein (a mixture is needed to get all the necessary amino acids), some vegetable oil, and some trace minerals and vitamins, dispersed in water would provide all the nutrition that meat does. This would be fairly tasteless, of course – but given the well developed modern science of artificial flavours and aromas, we could fairly easily reproduce a convincing meaty broth.

    But this, of course, misses out the vital importance of texture. Meat has a complex, hierarchical structure, and the experience of eating it reflects the way that structure is broken down in the mouth and the time profile of the flavours and textures it releases. Meat is made from animal muscle tissue, which develops to best serve what that particular muscle needs to do for the animal in its life. The cells in muscle are elongated to make fibres; the fibres bundle together to create the grain that’s familiar when we cut meat, but they also need to incorporate the connective tissue that allows the muscle to exert forces on the animal’s bones, and the blood-carrying vascular system that conveys oxygen and nutrients to the working muscle fibres. All of this influences the properties of the tissue when it becomes meat. The connective tissue is dominated by the protein material collagen, which consists of long molecules tightly bound together in triple helices.

    Muscles that do a lot of work – like the lower leg muscles that make up the beef cuts known as shin or leg – have a lot of connective tissue. These cuts of meat are very tough, but after long cooking at low temperatures the collagen breaks down; the triple helices come apart, and the separated long molecules give a silky texture to the gravy, enhanced by the partial reformation of the helical junctions as it cools. In muscles that do less work – like the underside of the loin that forms the fillet in beef – there is much less connective tissue, and the meat is very tender even without long cooking.

    High temperature grilling creates meaty flavours through a number of complex chemical reactions known as Maillard reactions, which are enhanced in the presence of carbohydrates in the flour and sugar that are used for barbecue marinades. Other flavours are fat soluble, carried in the fat cells characteristic of meat from well-fed animals that develop “marbling” of fat layers in the lean muscle. All of these characteristics are developed in the animal reflecting the life it leads before slaughter, and are developed further after butchering, storage and cooking.

    In “cultured” meat, individual precursor cells derived from an animal are grown in a suitable medium, using a “scaffold” to help the cells organise to form something resembling natural muscle tissue. There a a couple of key technical issues with this. The first is the need to provide the right growth medium for the cells, to provide an energy source, other nutrients, and the growth factors that simulate the chemical communications between cells in whole organisms.

    In the cell culture methods that have been developed for biomedical applications, the starting point for these growth media has been sera extracted from animal sources like cows. These are expensive – and obviously can’t produce an animal free product. Serum free growth media have been developed but are expensive, and optimising, scaling up and reducing the cost of these represent key barriers to be overcome to make “cultured meat” viable.

    The second issue is reproducing the vasculature of real tissue, the network of capillaries that conveys nutrients to the cells. It’s this that makes it much easier to grow a thin layer of cells than to make a thick, steak-like piece. Hence current proofs of principle of cultured meat are more likely to produce mince meat for burgers rather than whole cuts.

    I think there is a more fundamental problem in making the transition from cells, to tissue, to meat. One can make a three dimensional array of cells using a “scaffold” – a network of some kind of biopolymer that the cells can attach to and which guides their growth in the way that a surface does in a thin layer. But we know that the growth of cells is influenced strongly by the mechanical stimuli they are exposed to. This is obvious at the macroscopic scale – muscles that do more work, like leg muscles, grow in a different way that ones that do less – hence the difference between shin of beef and fillet steak. I find it difficult to see how, at scale, one could reproduce these effects in cell culture in a way that produces something that looks more like a textured piece of meat rather than a vaguely meaty mush.

    I think there is a simpler approach, which builds on the existing plant-based substitutes for meat already available in the supermarket. Start with a careful study of the hierarchical structures of various meats, at scales from the micron to the millimetre, before and after cooking. Isolate the key factors in the structure that produce a particular hedonic response – e.g. the size and dispersion of the fat particles, and their physical state; the arrangement of protein fibres, the disposition of tougher fibres of connective tissue, the viscoelastic properties of the liquid matrix and so on. Simulate these structures using plant derived materials – proteins, fats, gels with different viscoelastic properties to simulate connective tissue, and appropriate liquid matrices, devising processing routes that use physical processes like gelation and phase separation to yield the right hierarchical structure in a scalable way. Incorporate synthetic flavours and aromas in controlled release systems localised in different parts of the structure. All this is a development and refinement of existing food technology.

    At the moment, attempting something like this, we have start-ups like Impossible Burger and Beyond Meat, with new ideas and some distinct intellectual property. There are established food multinationals, like Unilever, moving in with their depth of experience in branding, distribution and deep food science expertise. We already have products, many of which are quite acceptable in the limited market niches they are aiming at (typically minced meat for burgers and sauces). We need to move now to higher value and more sophisticated products, closer to whole cuts of meat. To do this we need some more basic food science research, drawing on the wide academic base in the life sciences, and integrating this with the chemical engineering for making soft matter systems with complex heterogenous structures at scale, often by non-equilibrium self-assembly processes.

    Food science is currently rather an unfashionable area, with little funding and few institutions focusing on it (for example, the UK’s former national Institute of Food Research in Norwich has pivoted away from classical food science to study the effect of the microbiome on human health). But I think the case for doing this is compelling. The strong recent rise in veganism and vegetarianism creates a large and growing market. But it does need public investment, because I don’t think intellectual property in this area will be very easy to defend. For this reason, large R&D investments by individual companies alone may be difficult to justify. Instead we need consortia bringing together multinationals like Unilever and players further downstream in the supply chain, like the manufacturers of ready meals and suppliers to fast food outlets, together with a relatively modest increase in public sector applied research. Food science may not be as glamorous as a new approach to nuclear fusion, but maybe turn out to be just as important in the fight against climate change.

    [1]. See also this interesting article by Alex Smith and Saloni Shah – The Government Needs an Innovation Policy for Alternative Meats – which makes the case for an industrial strategy for alternative meats, but is more optimistic about the prospects for cell culture than I am.

    The Prime Minister’s office asserts control over UK science policy

    The Daily Telegraph published a significant article from the Prime Minister about science and technology this morning, to accompany a government announcement “Prime Minister sets out plans to realise and maximise the opportunities of scientific and technological breakthroughs”.

    Here are a few key points I’ve taken away from these pieces.

    1. There’s a reassertion in the PM’s article of the ambition to raise government spending on science from its current value of £14.9 billion to a new target of £22 bn (though no date is attached to this target), together with recognition that this needs to lever in substantially more private sector R&D spending to meet the overall target of the goal of total R&D spending – public and private – of 2.4% of GDP. The £22bn spending goal was promised in the March 2020 budget, but had since disappeared from HMT documents.

    2. But there’s a strong signal that this spending will be directed to support state priorities: “It is also the moment to abandon any notion that Government can be strategically indifferent”.

    3. A new committee, chaired by the Prime Minister, will be set up – the National Science and Technology Council. This will establish those state priorities: “signalling the challenges – perhaps even to specify the breakthroughs required”. This could be something like the ministerial committee recommended in the Nurse Review, which it was proposed would coordinate the government’s response to science and technology challenges right across government.

    4. There is an expanded role for the Government Chief Scientific Advisor, Sir Patrick Vallance, as National Technology Advisor, in effect leading the National Science and Technology Council.

    5. A new Office for Science and Technology Strategy is established to support the NSTC. This is based in the Cabinet Office – emphasising its whole-of-government remit. Presumably this supersedes, and/or incorporates, the existing Government Office of Science, which is now based in BEIS.

    6. There is a welcome recognition of some of the current weaknesses of the UK’s science and innovation – the article talks about restoring Britain’s status as a science superpower” (my emphasis), after decades of failure to invest, both by the state and by British industry: “this country has failed for decades to invest enough in scientific research, and that strategic error has been compounded by the decisions of the UK private sector”. The article highlights the UK’s loss of capacity in areas like vaccine manufacture and telecoms.

    7. The role of the new funding agency ARIA is defined as looking for “Unknown unknowns”, while NSTC sets out priorities supporting missions like net zero, cyber threats and medical issues like dementia. There is no mention of the UK’s current main funder of upstream research – UKRI – but presumably its role is to direct the more upstream science base to support the missions as defined by NSTC.

    8. The role of science and technology in creating economic growth remains important, with an emphasis on scientifically led start-ups and scale-ups, and a reference to “Levelling up” by spreading technology led economic growth outside the Golden Triangle to the whole country.

    As always, the effectiveness with which a reorganised structure delivers meaningful results will depend on funding decisions made in the Autumn’s spending review – and thus the degree to which HM Treasury is convinced by the arguments of the NSTC, or compelled by the PM to accept them.